Fig. 5
Download original image
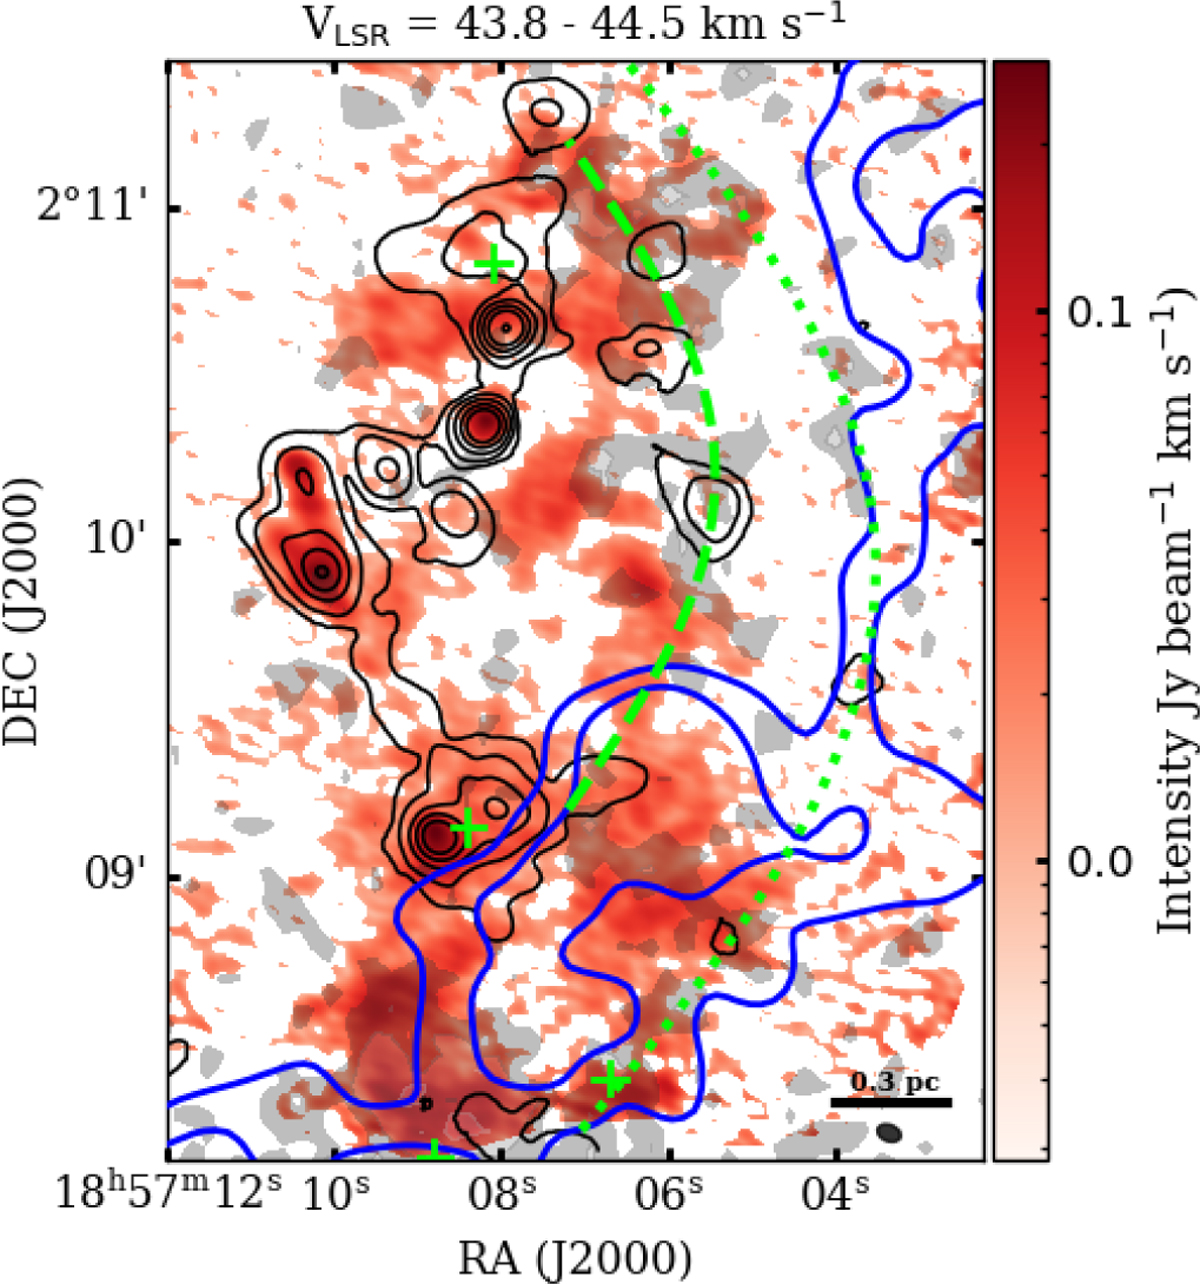
This figure shows the integrated intensity map of CH3OH over the blue-shifted velocity range. The red background represents the CH3OH integrated intensity, overlaid with SiO (2–1) emission (black contours) and C18O (1–0) emission (gray contours). The integrated velocity ranges from 43.8 to 44.5 km s−1, which represents the blue-shifted gas. SiO black contour levels are 21 (3σ), 210, 630, 1050, and 2300 (peak value) mJy beam−1 km s−1. The C18O gray contour levels are 0.738, 1.107, 1.476, and 1.738 K km s−1 (peak value). The blue contours display 610 MHz emission at 1.1 (5σ) and 1.54 (7σ) mJy beam−1 from Paredes et al. (2014). Green crosses mark the locations of the identified cores. Green dashed and dotted lines indicated the arc-like structures. The beam size is displayed in the lower-right corner.
Current usage metrics show cumulative count of Article Views (full-text article views including HTML views, PDF and ePub downloads, according to the available data) and Abstracts Views on Vision4Press platform.
Data correspond to usage on the plateform after 2015. The current usage metrics is available 48-96 hours after online publication and is updated daily on week days.
Initial download of the metrics may take a while.