Fig. 6
Download original image
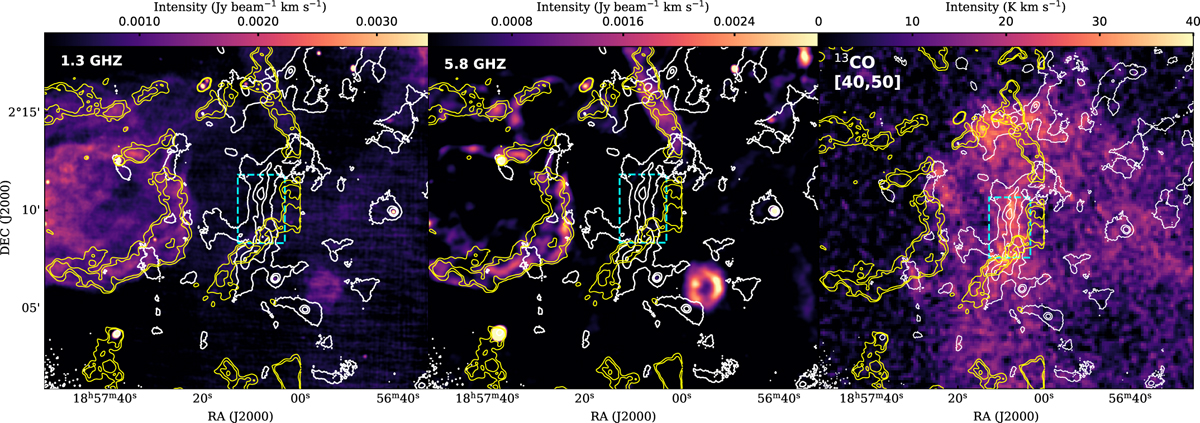
This figure shows the large-scale radio continuum and molecular gas emission around Cloud H. Left panel: 1.3 GHz radio continuum emission obtained from MeerKAT survey Goedhart et al. (2024). The background displays 1.3 GHz emission, overlaid with yellow contours representing 610 MHz emission at levels of 1.1 (5σ) and 1.54 (7σ) mJy beam−1 from Paredes et al. (2014). White contours represent the 850 µm continuum emission obtained with JCMT/SCUBA-2 (Shen et al. 2024), with levels at 55, 220, 440 mJy beam−1. The cyan rectangle indicates the field of view for the ALMA observation. Middle panel: 5.8 GHz radio continuum emission obtained from GLOSTAR survey (Medina et al. 2019). The background displays 5.8 GHz emission, with yellow contours representing 610 MHz emission. Other symbols are the same as those in the left panel. Right panel: 13CO integrated intensity map from FUGIN survey (Umemoto et al. 2017). The background shows 13CO (1–0) emission, with yellow contours representing 610 MHz emission. The integrated velocity range is shown in the upper-left corner. Other symbols are the same as those in the left panel.
Current usage metrics show cumulative count of Article Views (full-text article views including HTML views, PDF and ePub downloads, according to the available data) and Abstracts Views on Vision4Press platform.
Data correspond to usage on the plateform after 2015. The current usage metrics is available 48-96 hours after online publication and is updated daily on week days.
Initial download of the metrics may take a while.