Fig. A.1
Download original image
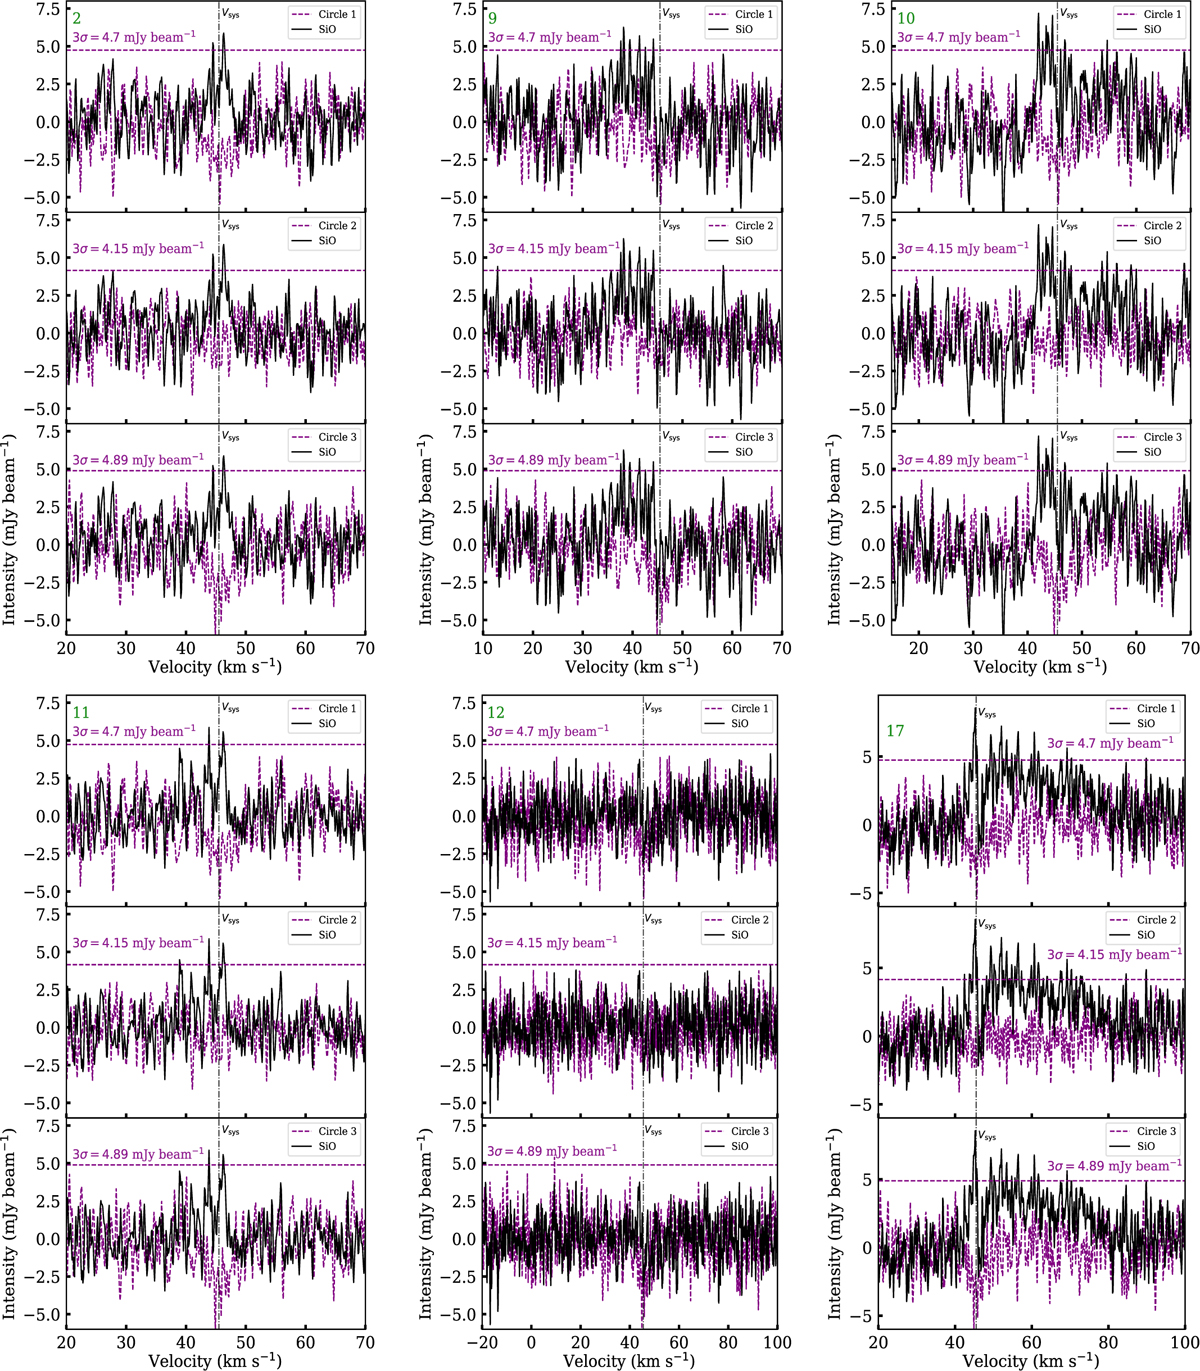
This figure shows a comparison of the SiO spectra extracted from regions with low signal-to-noise and non-detected SiO emission. Black curves represent the SiO spectra extracted from positions 2, 9, 10, 11, 12, and 17. The purple curves show the SiO spectra extracted from the purple circular regions with no SiO emission, as indicated in Figure 2. The numbers at the upper-right corner of each panel correspond to the labels of these circular regions. The purple dashed parallel lines indicate the 3σ noise levels of the SiO emission from non-emission regions. The vertical dashed-dotted black line marks the central velocity of Cloud H (45.5 km −1).
Current usage metrics show cumulative count of Article Views (full-text article views including HTML views, PDF and ePub downloads, according to the available data) and Abstracts Views on Vision4Press platform.
Data correspond to usage on the plateform after 2015. The current usage metrics is available 48-96 hours after online publication and is updated daily on week days.
Initial download of the metrics may take a while.