Fig. A.2
Download original image
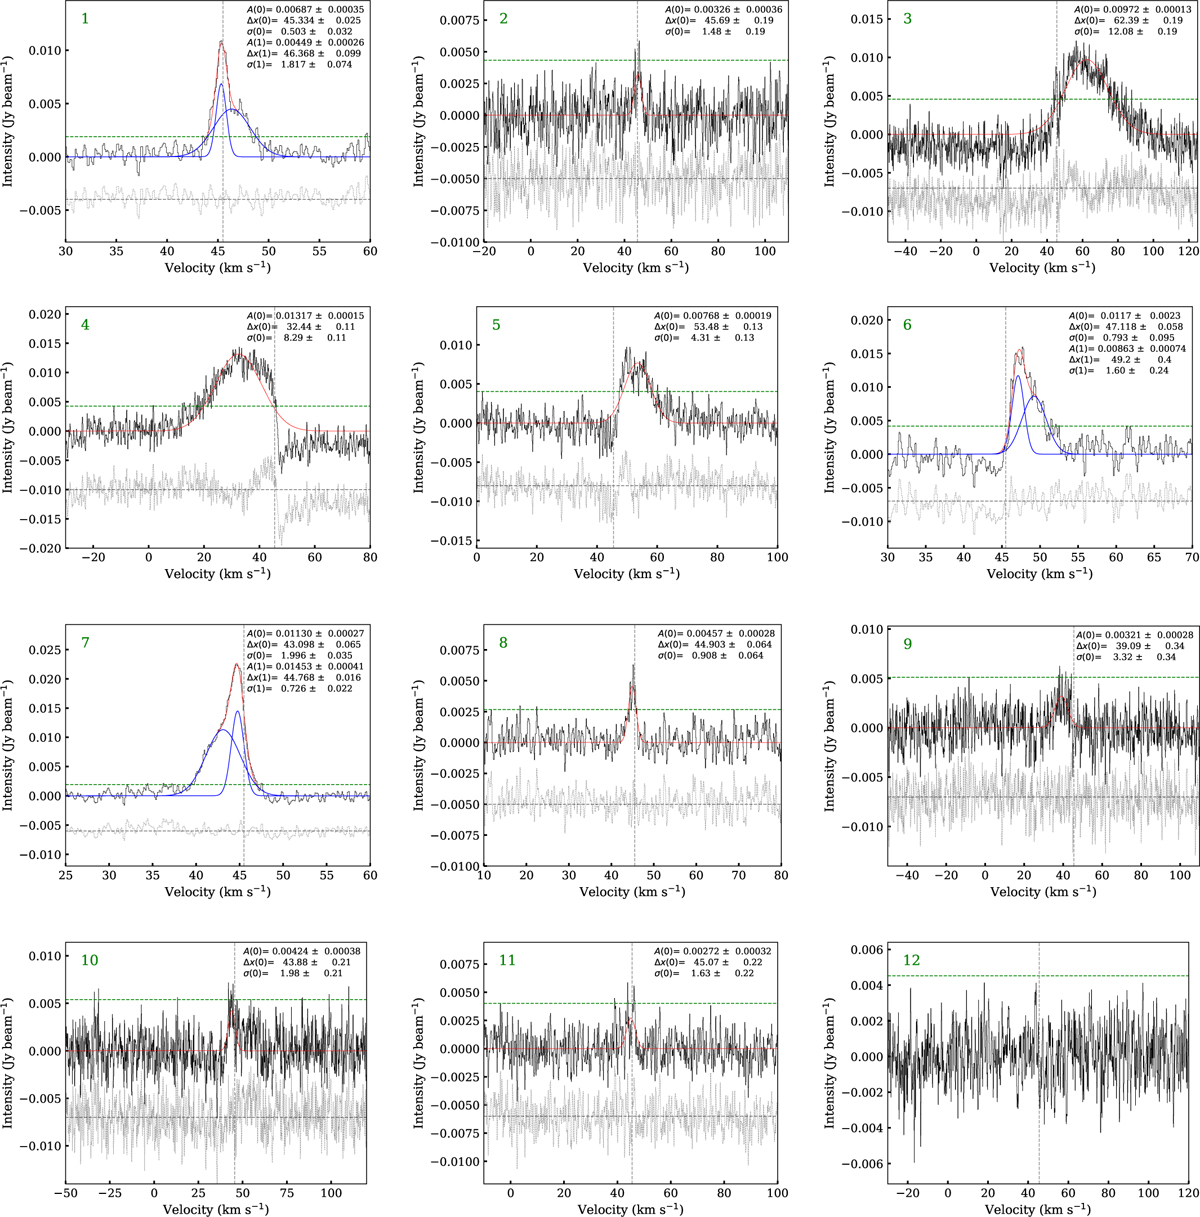
This figure shows the SiO spectra together with the results of Gaussian fitting. Black curves represent the SiO spectra extracted from positions in Figure 2. The red curves report the total Gaussian fits to the SiO spectra using pyspeckit and the blue curves represent the Gaussian fit lines of the different components. The green dashed parallel line indicates the 3σ noise levels of the SiO emission. The vertical dashed gray line marks the central velocity of Cloud H (45.5 km −1). The residuals of the fitting results are shown as gray lines at the bottom of each panel, with the gray parallel line representing the residual zero baseline. The corresponding green numbers (see Figure 2) are displayed at the top left corner of each panel, and the Gaussian fitting results are shown at the top right corner.
Current usage metrics show cumulative count of Article Views (full-text article views including HTML views, PDF and ePub downloads, according to the available data) and Abstracts Views on Vision4Press platform.
Data correspond to usage on the plateform after 2015. The current usage metrics is available 48-96 hours after online publication and is updated daily on week days.
Initial download of the metrics may take a while.