Fig. 1.
Download original image
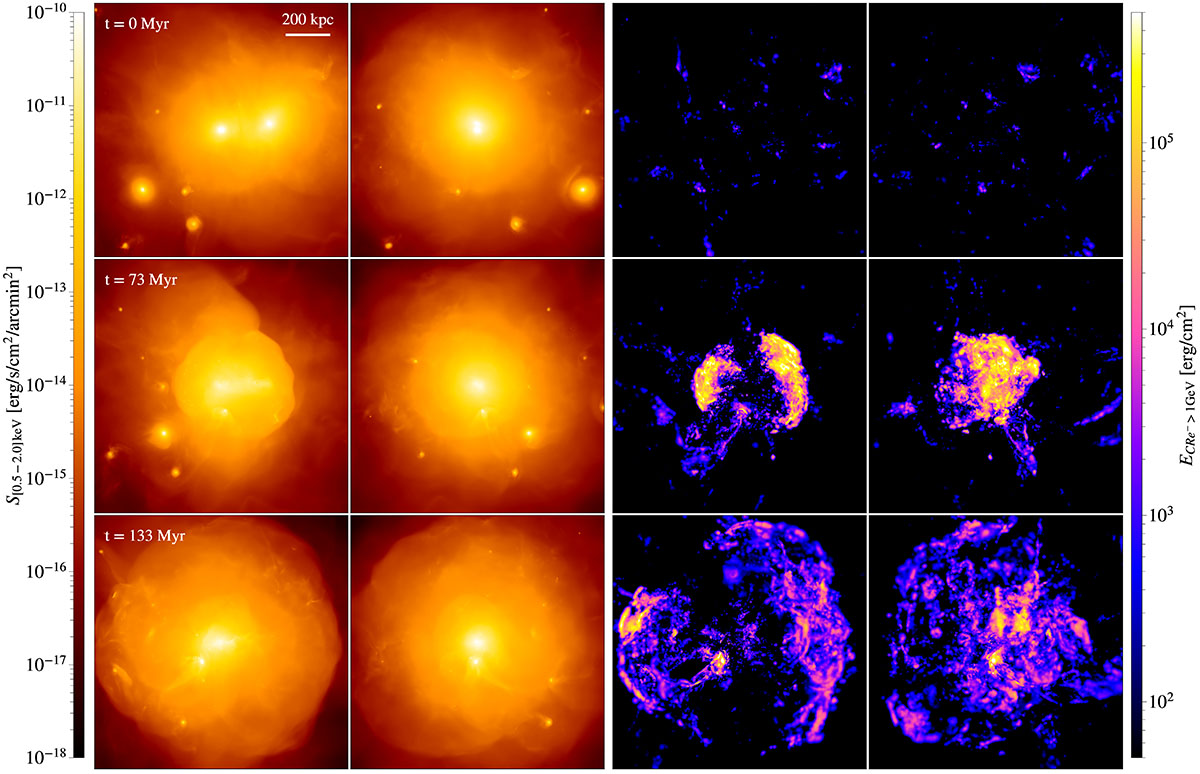
Time evolution of the circumgalactic medium of the simulated galaxy group, showing the central region at three successive moments close to the merger event. The two columns display maps of the X-ray surface brightness and the projected energy density of cosmic ray electrons, while the two panels in each column represent two orthogonal sight lines. For the X-ray map, we assume a distance of z = 0.017. The scale bar (the top left panel) indicates 200 kpc. The time labels provide the elapsed time since shortly before the merger event.
Current usage metrics show cumulative count of Article Views (full-text article views including HTML views, PDF and ePub downloads, according to the available data) and Abstracts Views on Vision4Press platform.
Data correspond to usage on the plateform after 2015. The current usage metrics is available 48-96 hours after online publication and is updated daily on week days.
Initial download of the metrics may take a while.