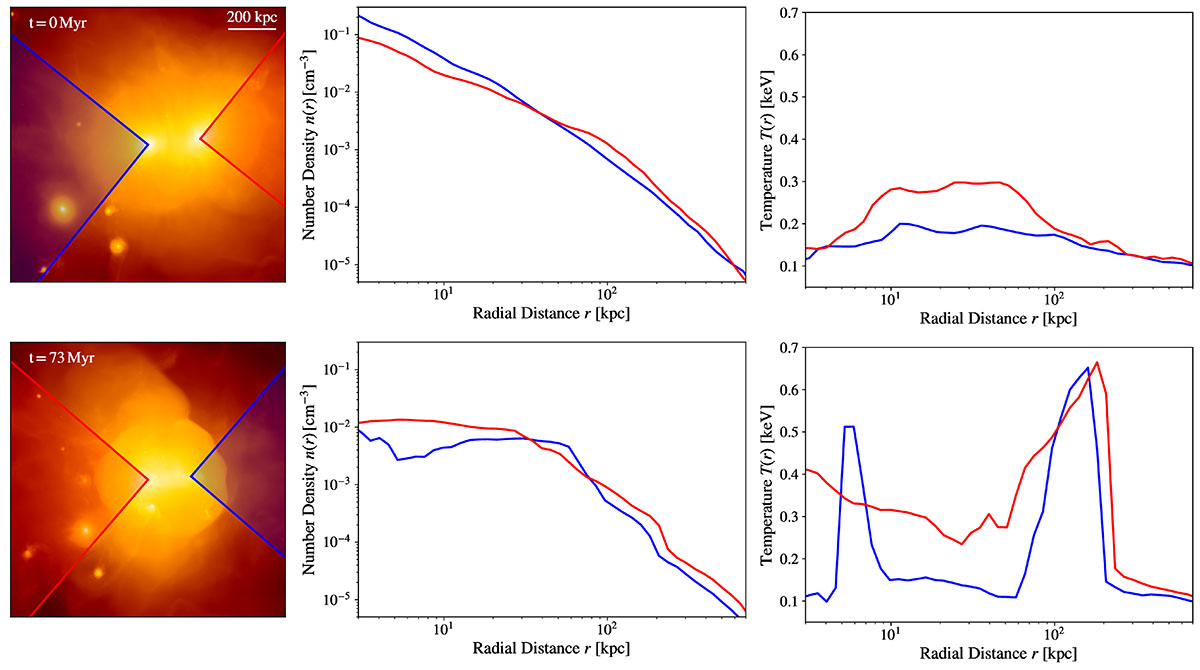
Fig. 2.
Download original image
Radial profiles of the hot X-ray emitting gas properties in the circumgalactic medium of the merging galaxies. Left, from top to bottom: X-ray surface brightness maps shortly before and after the merger event (see Sect. 3.1). The blue- and red-shaded regions in each panel indicate the extent of the 3D cones used to compute the radial profiles of the gas number density n(r) (centre column) and temperature T(r) (right column) for the two merging galaxies. The cones are centred on the local potential minimum of the respective dark matter halo.
Current usage metrics show cumulative count of Article Views (full-text article views including HTML views, PDF and ePub downloads, according to the available data) and Abstracts Views on Vision4Press platform.
Data correspond to usage on the plateform after 2015. The current usage metrics is available 48-96 hours after online publication and is updated daily on week days.
Initial download of the metrics may take a while.