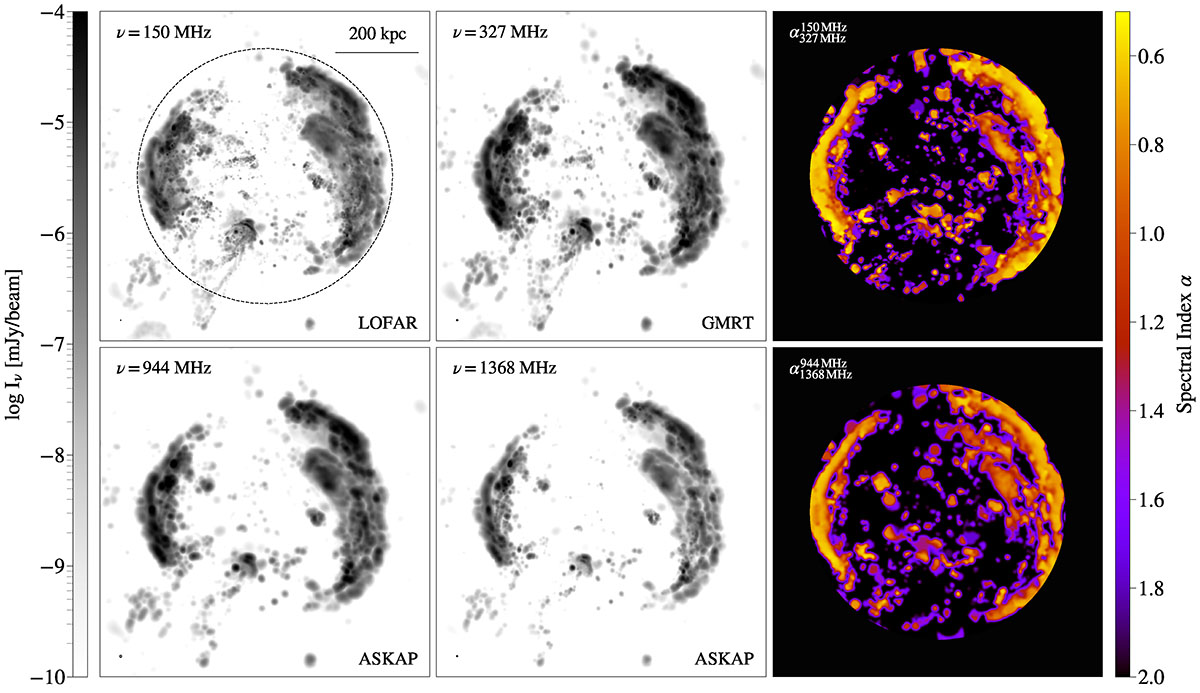
Fig. 3.
Download original image
Mock images of the simulated ORC at t = 73 Myr. Left and centre: Synchrotron flux density at four frequencies (indicated in the top-left corner of each panel). The images are smoothed with a Gaussian kernel length matching the respective resolution of the telescope, shown in the bottom of each panel. Right: Spectral index derived from the two left panels. We applied a circular mask in these images to highlight the circular shape, where its extent is indicated by the dashed line in the upper left panel.
Current usage metrics show cumulative count of Article Views (full-text article views including HTML views, PDF and ePub downloads, according to the available data) and Abstracts Views on Vision4Press platform.
Data correspond to usage on the plateform after 2015. The current usage metrics is available 48-96 hours after online publication and is updated daily on week days.
Initial download of the metrics may take a while.