Fig. 7.
Download original image
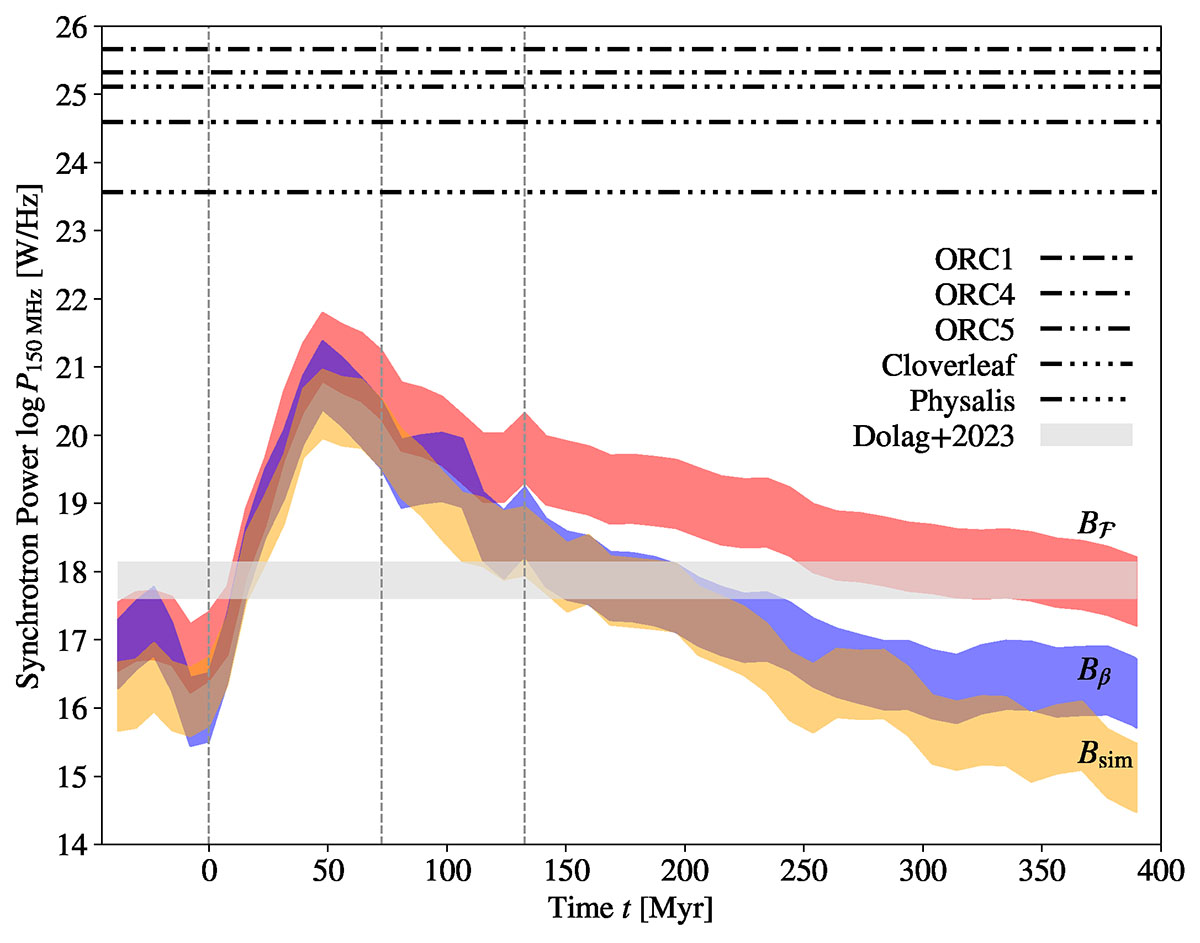
Comparison of the radio luminosity profile of the simulated ORC with observations. The three coloured regions show the synchrotron power at ν = 150 MHz inferred from three different magnetic field models (see text for details). The grey band represents the result from the simulation by Dolag et al. (2023), while the horizontal dashed-dotted lines indicate the level of observed counterparts at the respective frequencies: ORC1 (Norris et al. 2022), ORC4 (Norris et al. 2021b), ORC5 (Koribalski et al. 2021), Cloverleaf (Koribalski et al. in prep.) and Physalis (Koribalski et al. 2024b). The vertical dashed lines mark the three time steps chosen for the visualisation of the merger sequence in Fig. 1.
Current usage metrics show cumulative count of Article Views (full-text article views including HTML views, PDF and ePub downloads, according to the available data) and Abstracts Views on Vision4Press platform.
Data correspond to usage on the plateform after 2015. The current usage metrics is available 48-96 hours after online publication and is updated daily on week days.
Initial download of the metrics may take a while.