Fig. A.1
Download original image
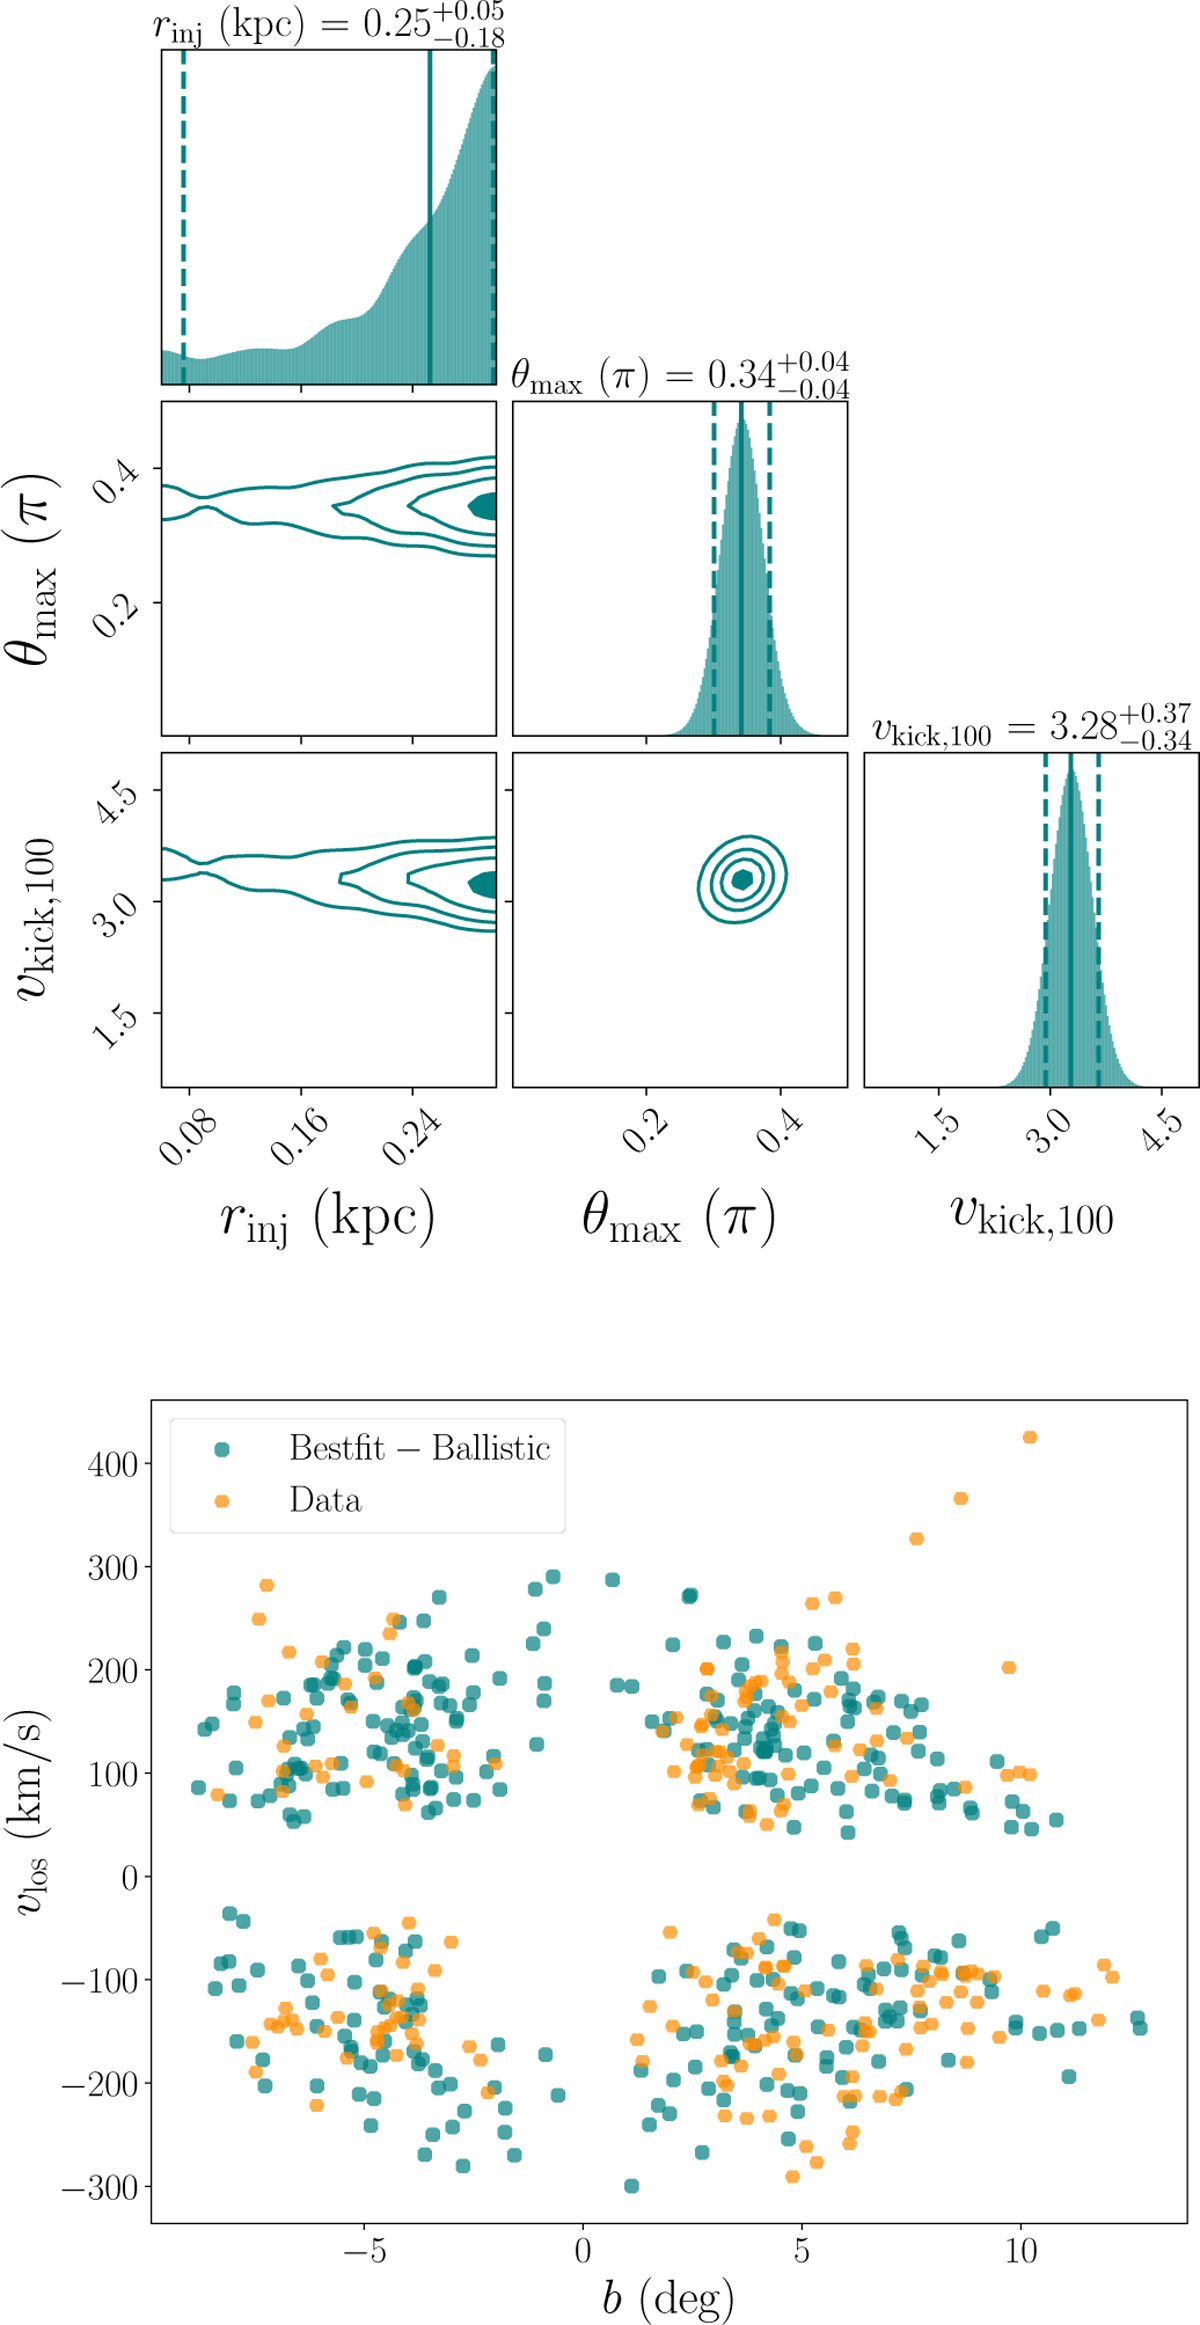
Main results of the ballistic models presented in Appendix A. Top: corner plot showing the posterior distributions of the three free parameters; the vertical lines mark the positions of the median values of the posteriors and of the 2 - σ uncertainties. Bottom: comparison between the outputs of the best-fit models (teal) and the observations (orange).
Current usage metrics show cumulative count of Article Views (full-text article views including HTML views, PDF and ePub downloads, according to the available data) and Abstracts Views on Vision4Press platform.
Data correspond to usage on the plateform after 2015. The current usage metrics is available 48-96 hours after online publication and is updated daily on week days.
Initial download of the metrics may take a while.