Open Access
Fig. B.2
Download original image
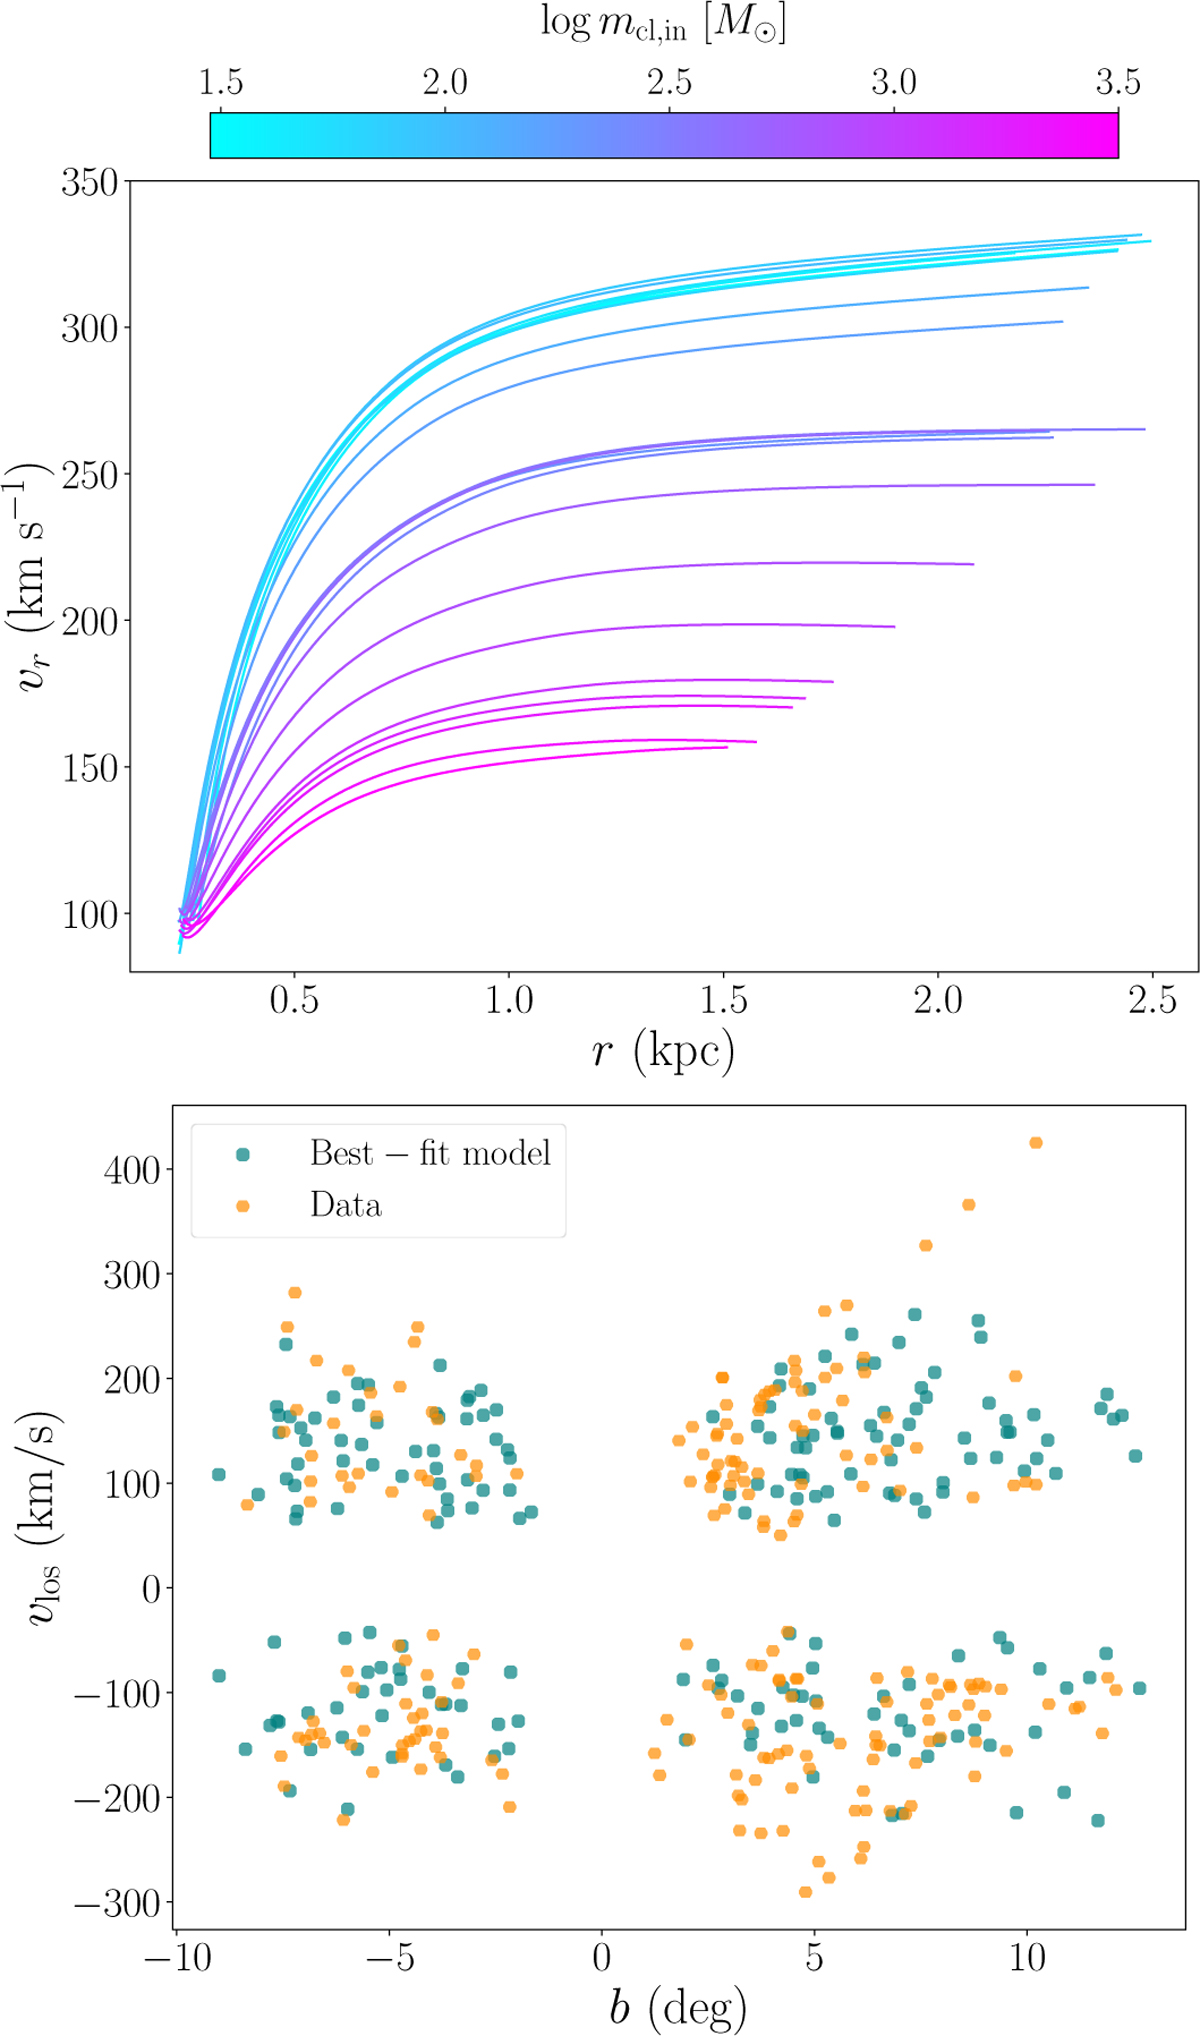
Outputs of the best-fit model assuming a massive hot wind (see Figure B.1 and Appendix B). Top: Radial velocities of 20 typical clouds as a function of the distance from the center, color-coded by the cloud initial mass. Bottom: Comparison between the outputs of the bestfit models (teal) and the observations (orange).
Current usage metrics show cumulative count of Article Views (full-text article views including HTML views, PDF and ePub downloads, according to the available data) and Abstracts Views on Vision4Press platform.
Data correspond to usage on the plateform after 2015. The current usage metrics is available 48-96 hours after online publication and is updated daily on week days.
Initial download of the metrics may take a while.