Fig. 2
Download original image
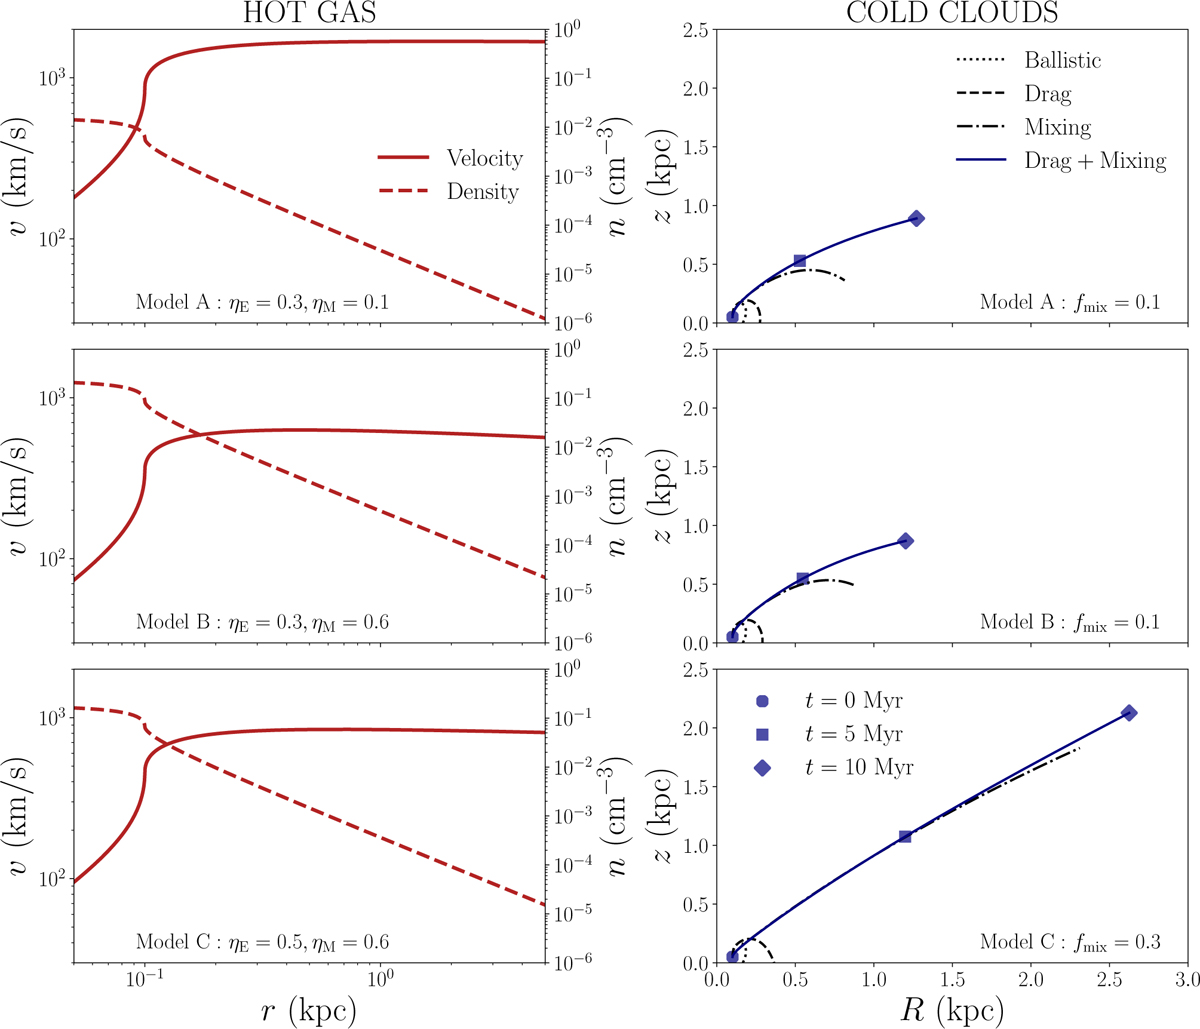
Behavior of the multiphase wind for three different choices of models (see main text): model A (top row), model B (central row), and model C (bottom row). On the left, hot gas velocities (solid curves) and densities (dashed curves) are shown as a function of the distance, r. The right panels show instead the cold cloud orbits (solid curves), indicating in particular the effects of drag (dashed curves) and mixing (dash-dotted curves) on the original ballistic orbit (dotted curves). The symbols mark the positions of the modeled cloud at the beginning (circles), after 5 Myr (squares) and after 10 Myr (rhomboids).
Current usage metrics show cumulative count of Article Views (full-text article views including HTML views, PDF and ePub downloads, according to the available data) and Abstracts Views on Vision4Press platform.
Data correspond to usage on the plateform after 2015. The current usage metrics is available 48-96 hours after online publication and is updated daily on week days.
Initial download of the metrics may take a while.