Fig. 5
Download original image
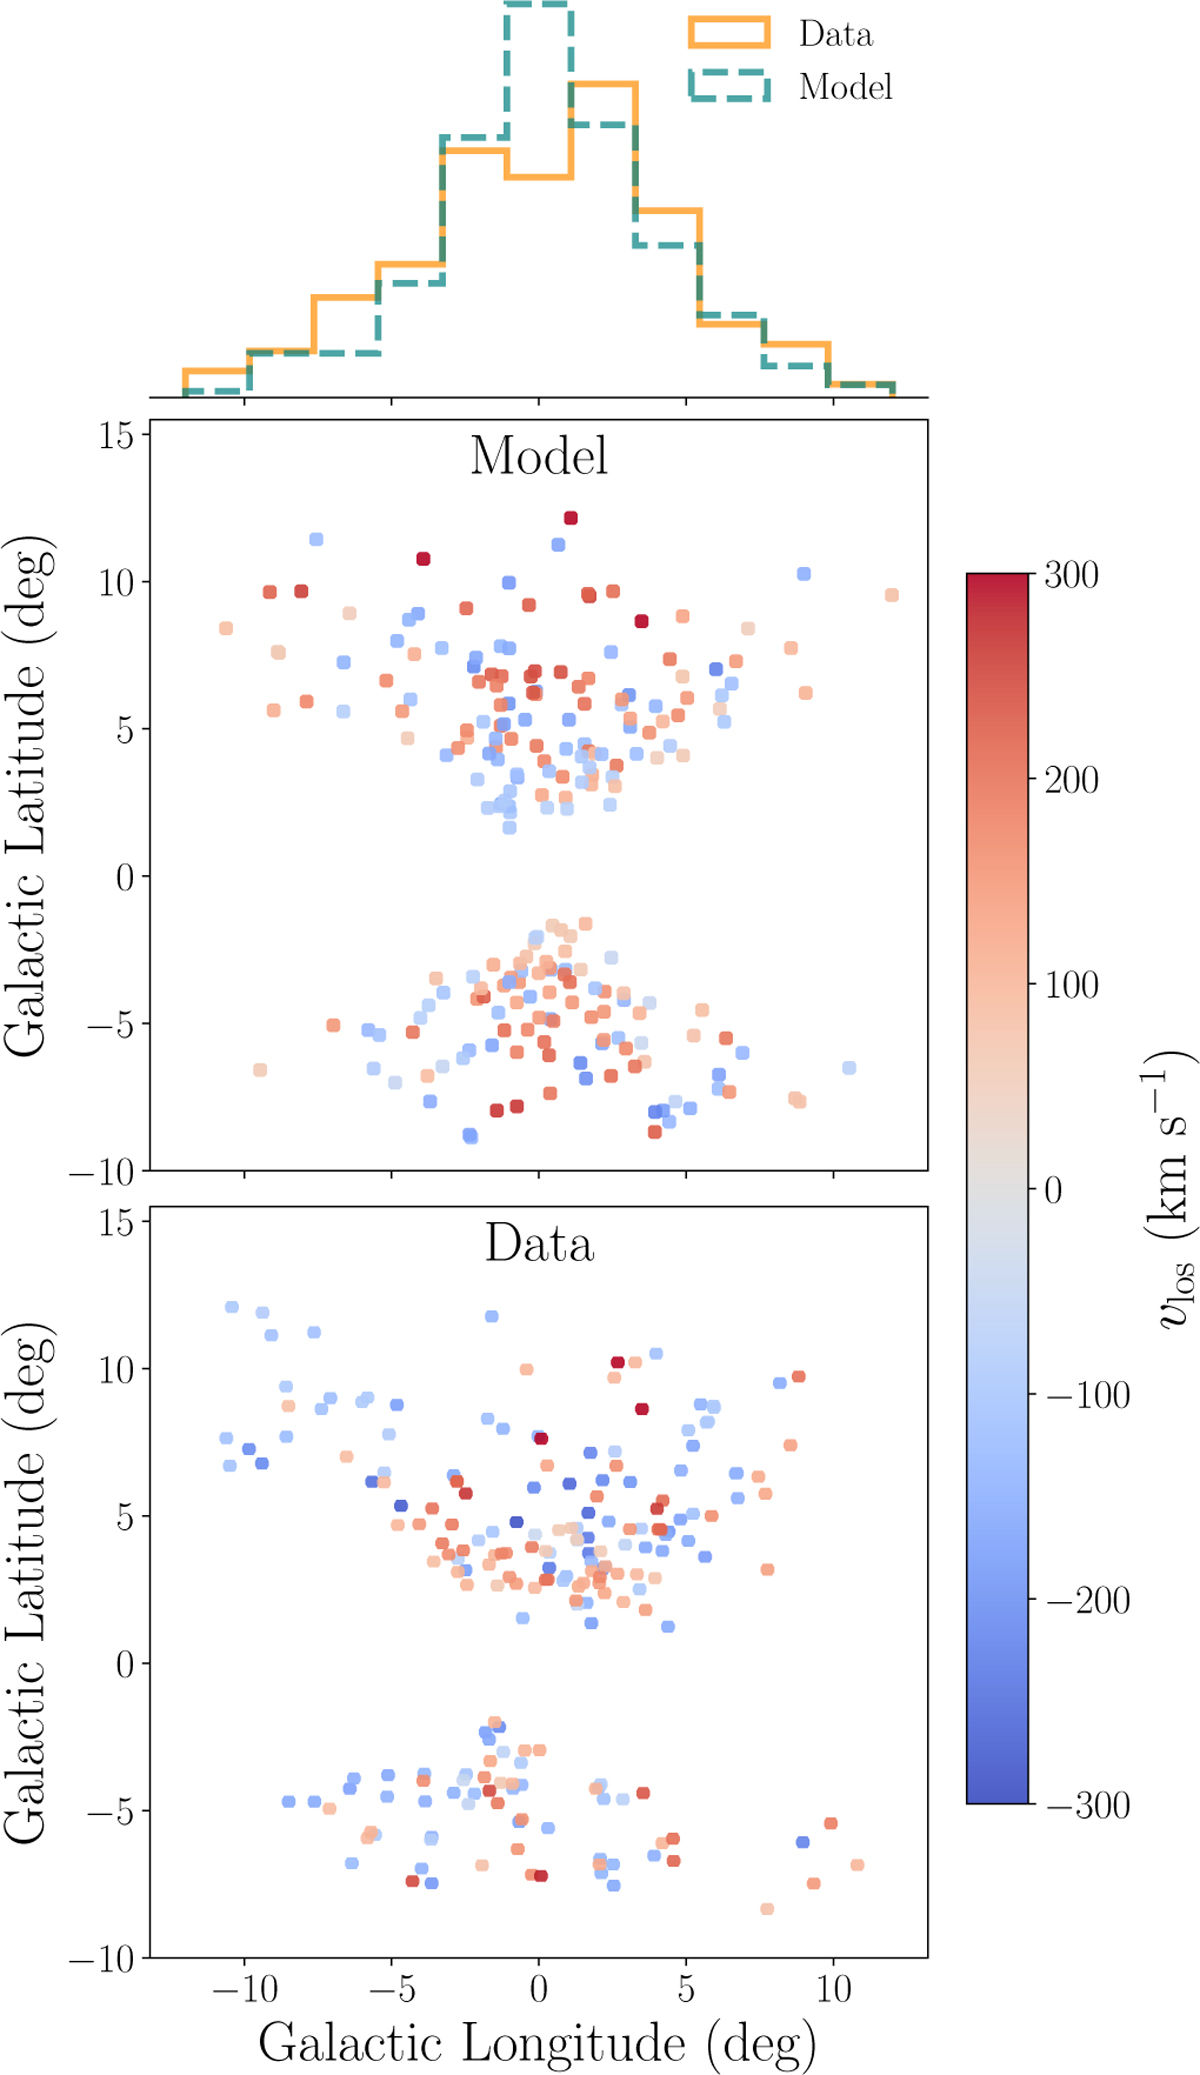
Comparison of the outputs of the best-fit models with the observational data. The cloud kinematics is shown as a function of Galactic longitude and latitude, with models on the top and data on the bottom. The one-dimensional distributions of the observed (orange, solid line) and the model (teal, dashed line) longitudes are reported on top.
Current usage metrics show cumulative count of Article Views (full-text article views including HTML views, PDF and ePub downloads, according to the available data) and Abstracts Views on Vision4Press platform.
Data correspond to usage on the plateform after 2015. The current usage metrics is available 48-96 hours after online publication and is updated daily on week days.
Initial download of the metrics may take a while.