Fig. 9
Download original image
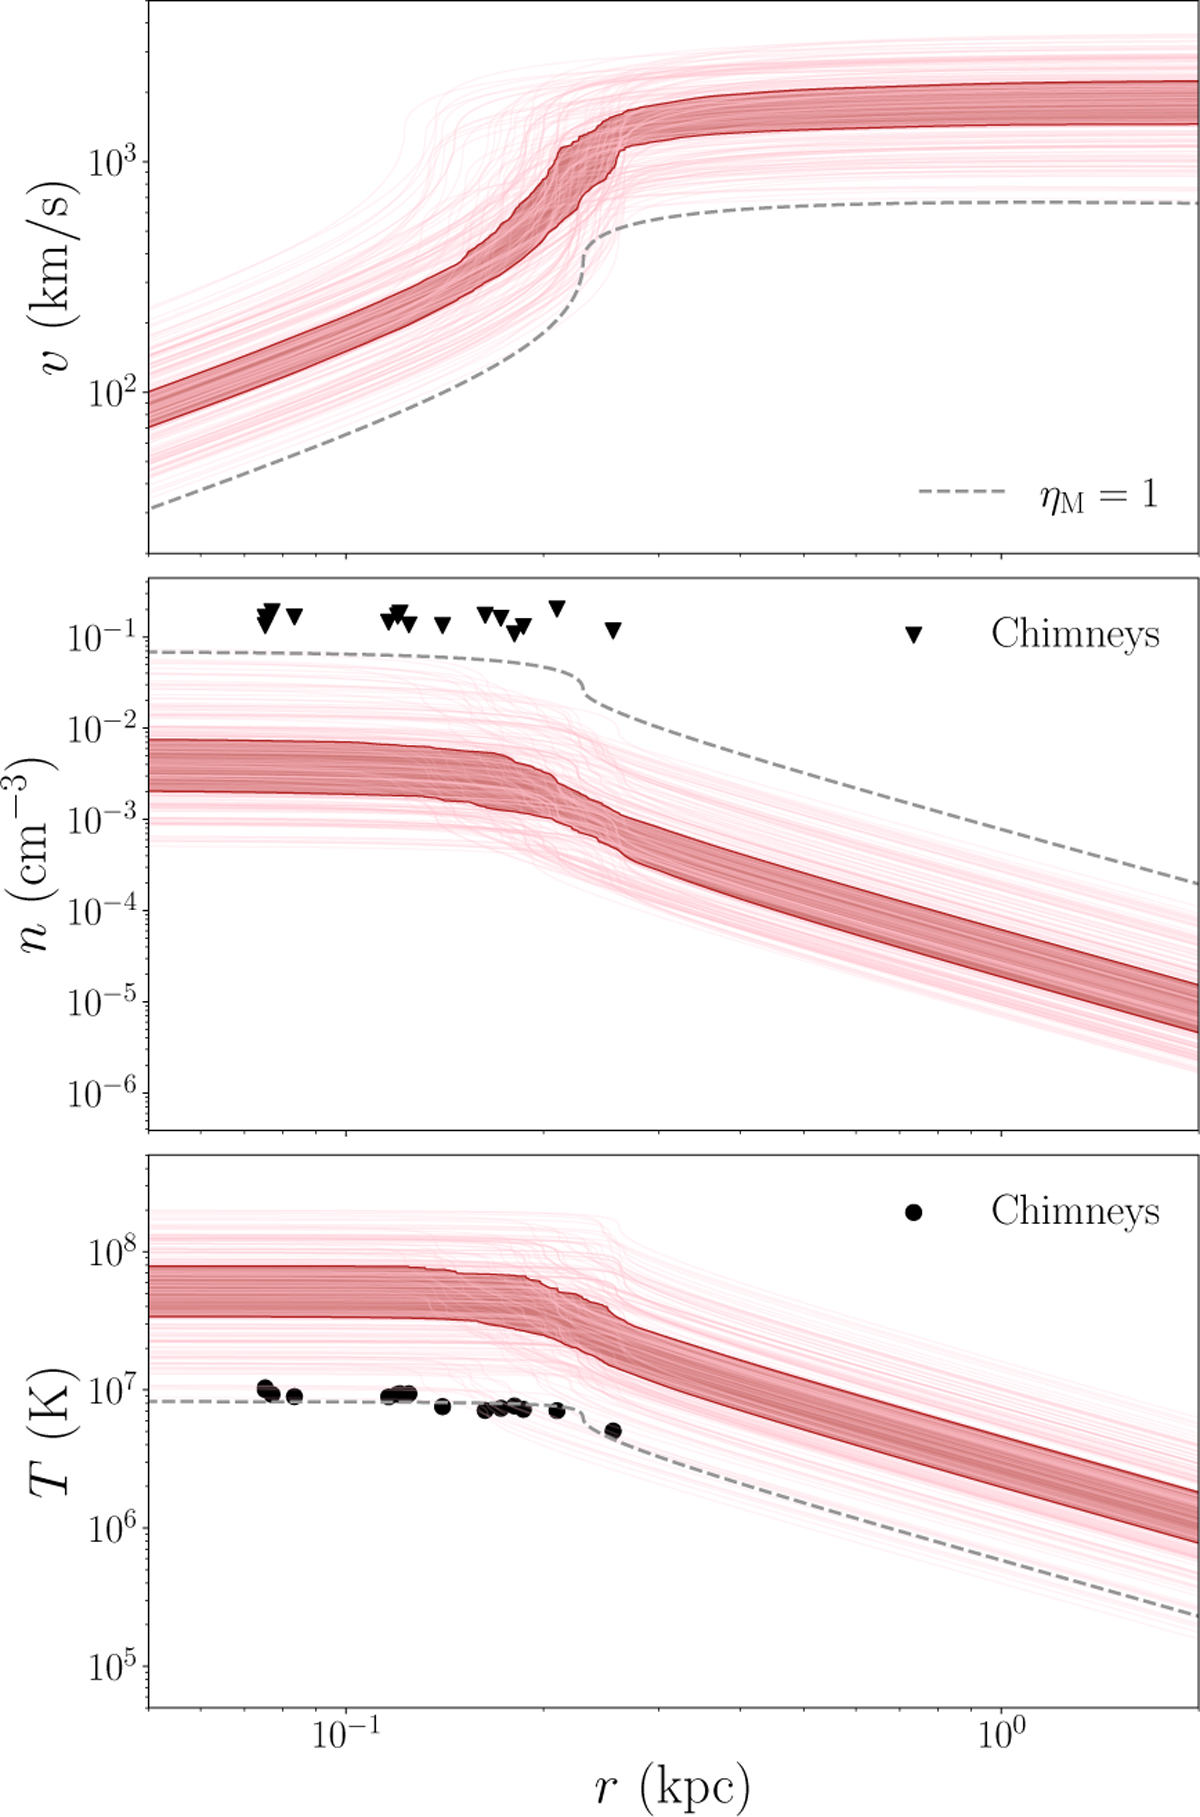
Properties of the hot wind predicted by our best-fit models (in red; see main text for more details), compared to recent X-ray observational constraints from XMM-Newton (Ponti et al. 2019). From top to bottom, hot gas velocity, density, and temperature. The dashed curves show the predictions for a model where the hot mass loading factor ηM is forced to values close to 1 (see Section 5.1.1).
Current usage metrics show cumulative count of Article Views (full-text article views including HTML views, PDF and ePub downloads, according to the available data) and Abstracts Views on Vision4Press platform.
Data correspond to usage on the plateform after 2015. The current usage metrics is available 48-96 hours after online publication and is updated daily on week days.
Initial download of the metrics may take a while.