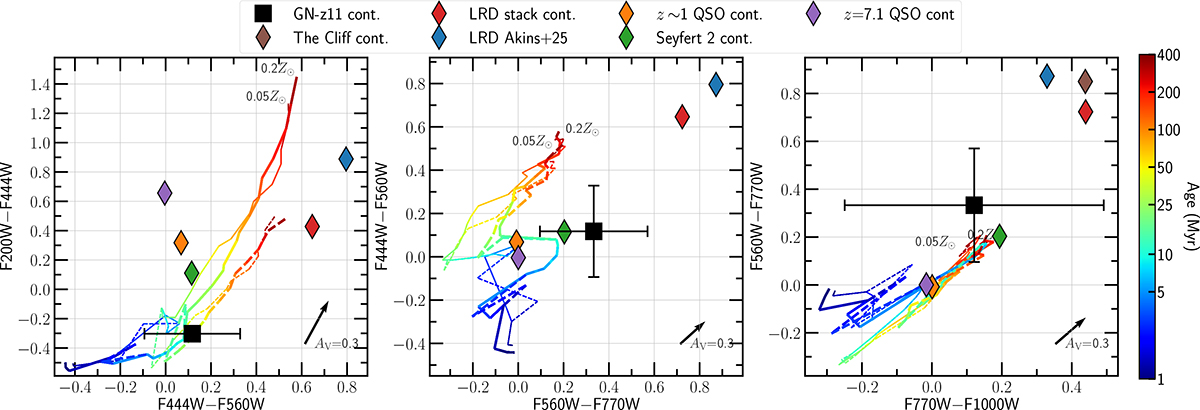
Fig. 2.
Download original image
Continuum-only colour-colour diagrams. Black squares represent the GN-z11 colours based on the NIRCam and MIRI photometry after the subtraction of the emission lines contribution measured with NIRSpec and MRS (i.e. continuum-only colours) presented in Table 1. Continuum (dashed) lines display the continuum-only colours derived considering a stellar population colour-coded by their age assuming an instantaneous (continuum) SFH. These colours include the contribution from the stellar continuum calculated using the stellar models from BPASSv2.2 and its associated nebular continuum derived with Cloudy (see Sect. 3.2). Thin and thick lines represent the 0.05 and 0.2 Z⊙ tracks, respectively. Orange, green, and purple diamonds show the derived continuum-only colours from the composed z∼ 1 QSO (Glikman et al. 2006; Selsing et al. 2016, see Sect. 3.3), the Seyfert 2 Mrk3 (Spinelli et al. 2006), and a z = 7.1 QSO (Bosman et al. 2024, 2025). Red, blue, and brown diamonds represent the values derived from a stacked spectra of ∼150 LRDs (Pérez-González et al. 2024; Pérez-González et al., in prep.), the COSMOS-Webb median-stacked LRD (Akins et al. 2025) and the unique LRD known as ‘The Cliff’ (de Graaff et al. 2025), respectively. In the left and middle panels, the brown diamond lie outside the colour range displayed. Black arrows in the lower right corners represent the vector magnitude for AV = 0.3 mag.
Current usage metrics show cumulative count of Article Views (full-text article views including HTML views, PDF and ePub downloads, according to the available data) and Abstracts Views on Vision4Press platform.
Data correspond to usage on the plateform after 2015. The current usage metrics is available 48-96 hours after online publication and is updated daily on week days.
Initial download of the metrics may take a while.