Fig. 3.
Download original image
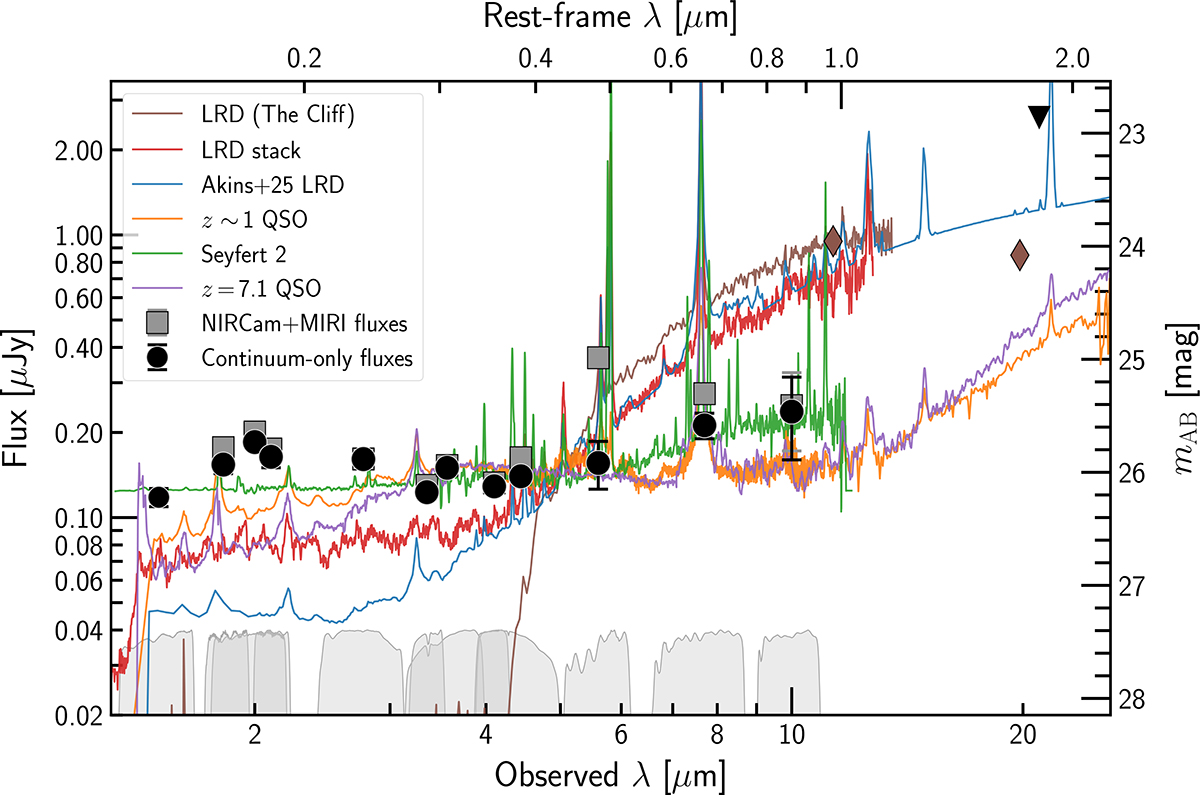
NIRCam and MIRI photometry compared with different red SED objects. Grey squares and black circles represent the NIRCam+MIRI observed and continuum-only (see Sect. 4.1) fluxes, respectively. Coloured lines represent the SEDs for different AGNs types and high-z objects with optical-red colours presented in Sect. 4.1. The red line represents the stacked spectra for ∼150 local and high-z LRDs (Pérez-González et al. 2024; Pérez-González et al., in prep.). The brown line displays the spectra from the exotic z ∼ 3.5 LRD The Cliff, while brown diamonds represent its re-normalised fluxes from de Graaff et al. (2025) at rest- 0.9 and 1.9 μm. The blue line shows the COSMOS-Webb median-stacked LRD SED model presented in Akins et al. (2025). The orange and purple lines show the z ∼ 1 QSO composite spectrum, created by combining the UV+optical and near-IR spectral templates from Selsing et al. (2016) and Glikman et al. (2006), and the NIRSpec+MRS spectrum for the z = 7.1 QSO J1120+0641 (Bosman et al. 2024, 2025), respectively. The HST/STIS spectrum for the Sy2 Mrk3 presented by Spinelli et al. (2006) is displayed as a green line. All observed spectra have been redshifted to z = 10.6 and normalised at 4800 Å.
Current usage metrics show cumulative count of Article Views (full-text article views including HTML views, PDF and ePub downloads, according to the available data) and Abstracts Views on Vision4Press platform.
Data correspond to usage on the plateform after 2015. The current usage metrics is available 48-96 hours after online publication and is updated daily on week days.
Initial download of the metrics may take a while.