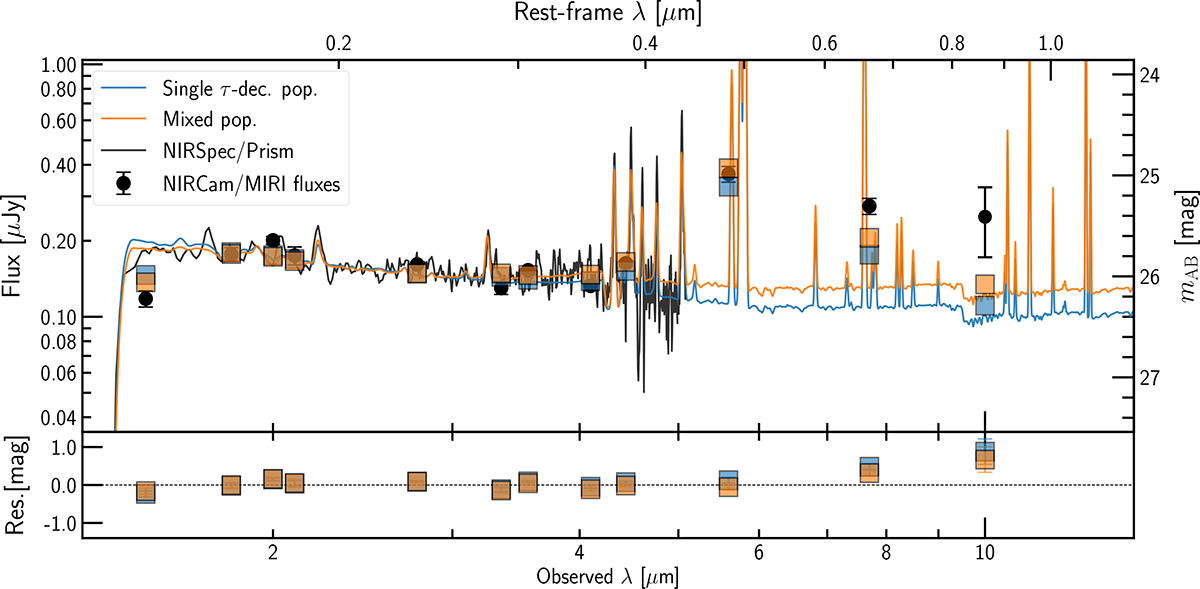
Fig. 4.
Download original image
CIGALE SED models derived from the single and mixed stellar population scenarios described in Sect. 4.2. Blue (orange) line and squares represent the SED models and the expected fluxes for NIRCam/MIRI filters derived using a single τ-decaying (mixed) stellar population. Black line and triangles represent the NIRSpec/Prism spectra and the NIRCam+MIRI photometry, respectively. The blue and orange lines have been convolved to match de NIRSpec/Prism resolution (R = 100).
Current usage metrics show cumulative count of Article Views (full-text article views including HTML views, PDF and ePub downloads, according to the available data) and Abstracts Views on Vision4Press platform.
Data correspond to usage on the plateform after 2015. The current usage metrics is available 48-96 hours after online publication and is updated daily on week days.
Initial download of the metrics may take a while.