Fig. 5.
Download original image
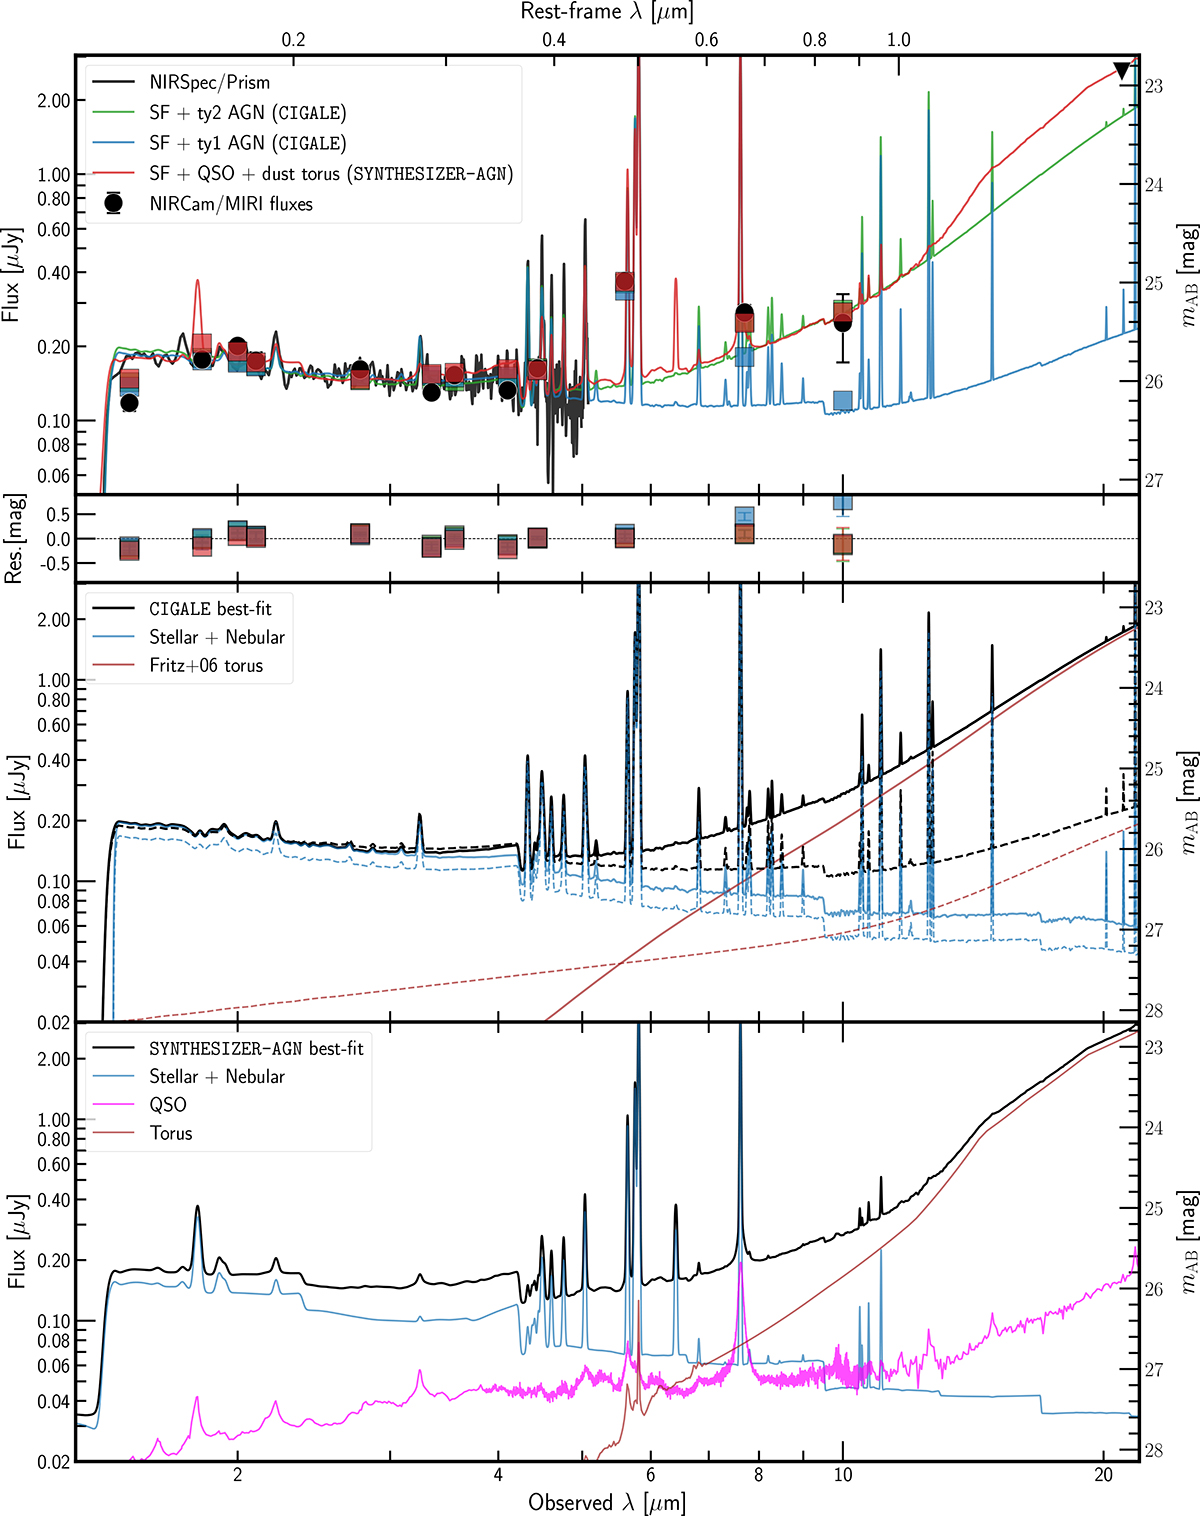
SED best-fit models considering the star formation and the different AGN scenarios. The top panel shows the best-fit SEDs obtained with CIGALE assuming type 1 and type 2 AGNs as blue and green lines, respectively. The red line displays the best-fit derived with SYNTHESIZER-AGN using a QSO template and an additional dusty torus. The black line and black circles represent the NIRSpec/Prism data presented in Bunker et al. (2023) and the NIRCam and MIRI photometry as derived in Sect. 3.1, respectively. Coloured squares show the modelled NIRCam and MIRI fluxes from the different best-fit models, while their residuals with the measured photometry are displayed below. Green, blue, and red lines have been convolved to match the spectral resolution from NIRSpec/Prism (i.e. R = 100). The middle panel shows the CIGALE best-fit models (in black) and the contributions of the nebular and stellar components (in blue) and the Fritz et al. (2006) torus emission (in brown). Dashed and continuous lines differentiate the results drawn from the SED fitting assuming a type 1 and type 2 AGN, respectively. The bottom panel displays the SYNTHESIZER-AGN best-fit (in black) along with the contributions of the nebular and stellar components (in blue), the QSO template (in magenta), and the dusty torus (in brown).
Current usage metrics show cumulative count of Article Views (full-text article views including HTML views, PDF and ePub downloads, according to the available data) and Abstracts Views on Vision4Press platform.
Data correspond to usage on the plateform after 2015. The current usage metrics is available 48-96 hours after online publication and is updated daily on week days.
Initial download of the metrics may take a while.