Fig. 1
Download original image
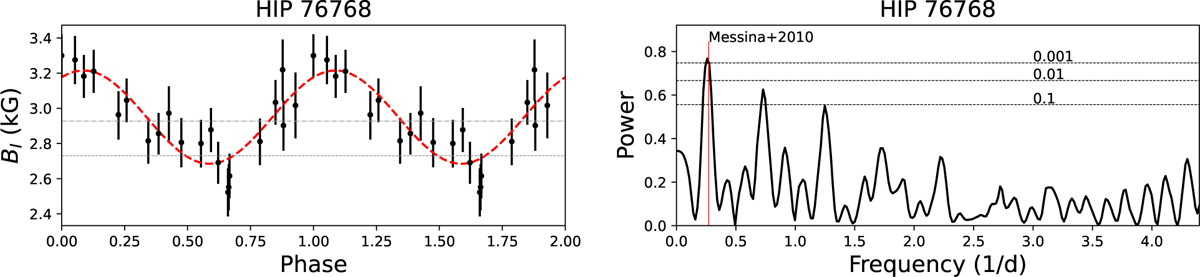
Magnetic field periodicity of HIP 76768. Left: total unsigned magnetic field variation of HIP 76768 phase-folded using the rotational period from Messina et al. (2010). The dashed red line represents the best-fit sinusoidal function to the data with the fixed rotational period from Table 2. The dashed grey line represents the average of the individual measurements, while the dotted line represents the total unsigned magnetic field obtained from the time-averaged spectrum. Right: lomb–Scargle periodogram obtained from the magnetic field measurements of HIP 76768. The dashed lines indicate false alarm probabilities. Also shown is the expected period from Table 2. Similar plots for all stars can be seen in Fig. A.1.
Current usage metrics show cumulative count of Article Views (full-text article views including HTML views, PDF and ePub downloads, according to the available data) and Abstracts Views on Vision4Press platform.
Data correspond to usage on the plateform after 2015. The current usage metrics is available 48-96 hours after online publication and is updated daily on week days.
Initial download of the metrics may take a while.