Fig. 3
Download original image
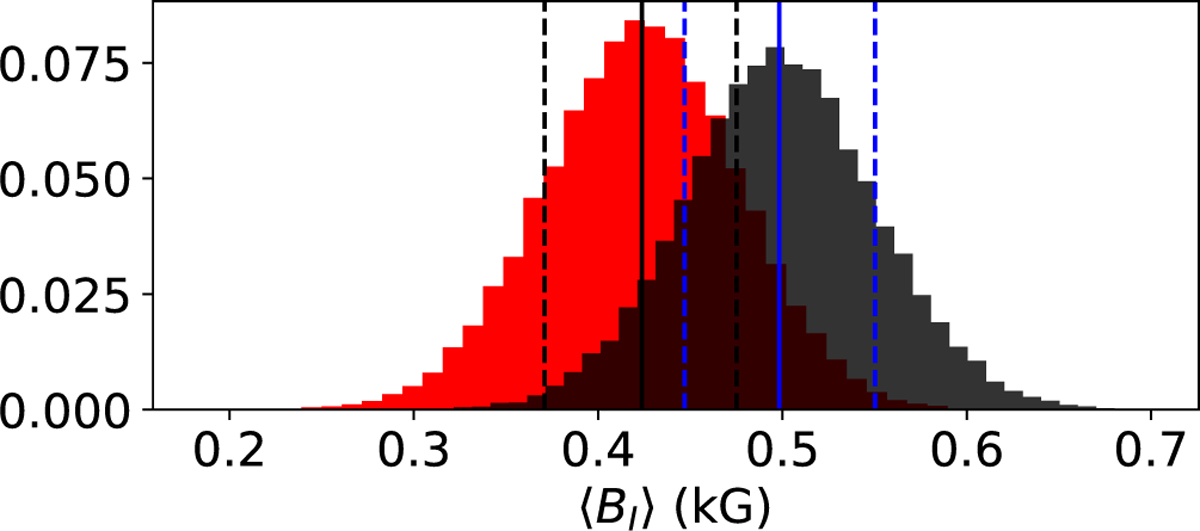
Posterior distribution of the total unsigned magnetic field strengths obtained from the time-averaged spectra of HH Leo from the two epochs. The distribution from the 2015 data is shown in red, and the shaded region represents the 2017 data. The black and blue lines represent median and 68% credence regions of the 2015 and 2017 datasets, respectively.
Current usage metrics show cumulative count of Article Views (full-text article views including HTML views, PDF and ePub downloads, according to the available data) and Abstracts Views on Vision4Press platform.
Data correspond to usage on the plateform after 2015. The current usage metrics is available 48-96 hours after online publication and is updated daily on week days.
Initial download of the metrics may take a while.