Fig. A.1
Download original image
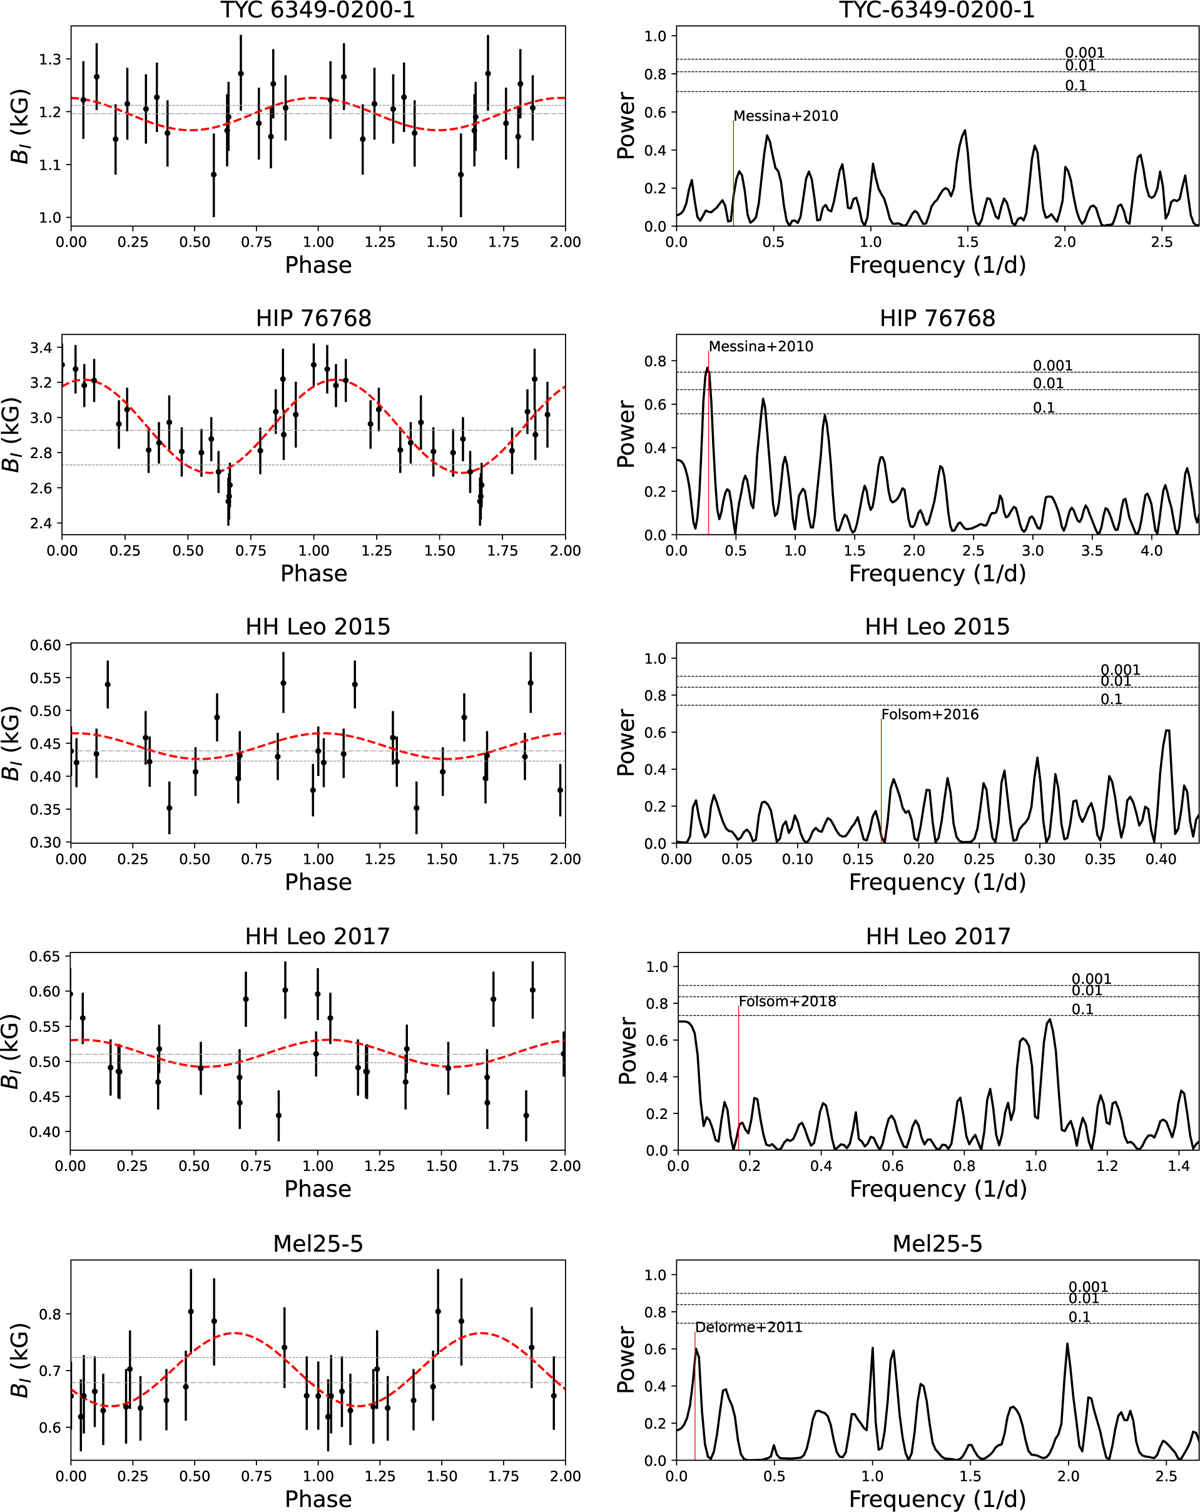
Magnetic variability for the stars studied in this work. Left column: Phase-folded magnetic field data along with the best fit sinusoidal function with periods from Table 2. The average magnetic field, both from the averaged spectra and the sinusoidal fit are shown as dotted and dashed lines, respectively. Right column: Periodograms of the magnetic sample, red lines marks the literature periods used for the sinusoidal fitting. False alarm probabilities are marked with dashed lines.
Current usage metrics show cumulative count of Article Views (full-text article views including HTML views, PDF and ePub downloads, according to the available data) and Abstracts Views on Vision4Press platform.
Data correspond to usage on the plateform after 2015. The current usage metrics is available 48-96 hours after online publication and is updated daily on week days.
Initial download of the metrics may take a while.