Fig. 7.
Download original image
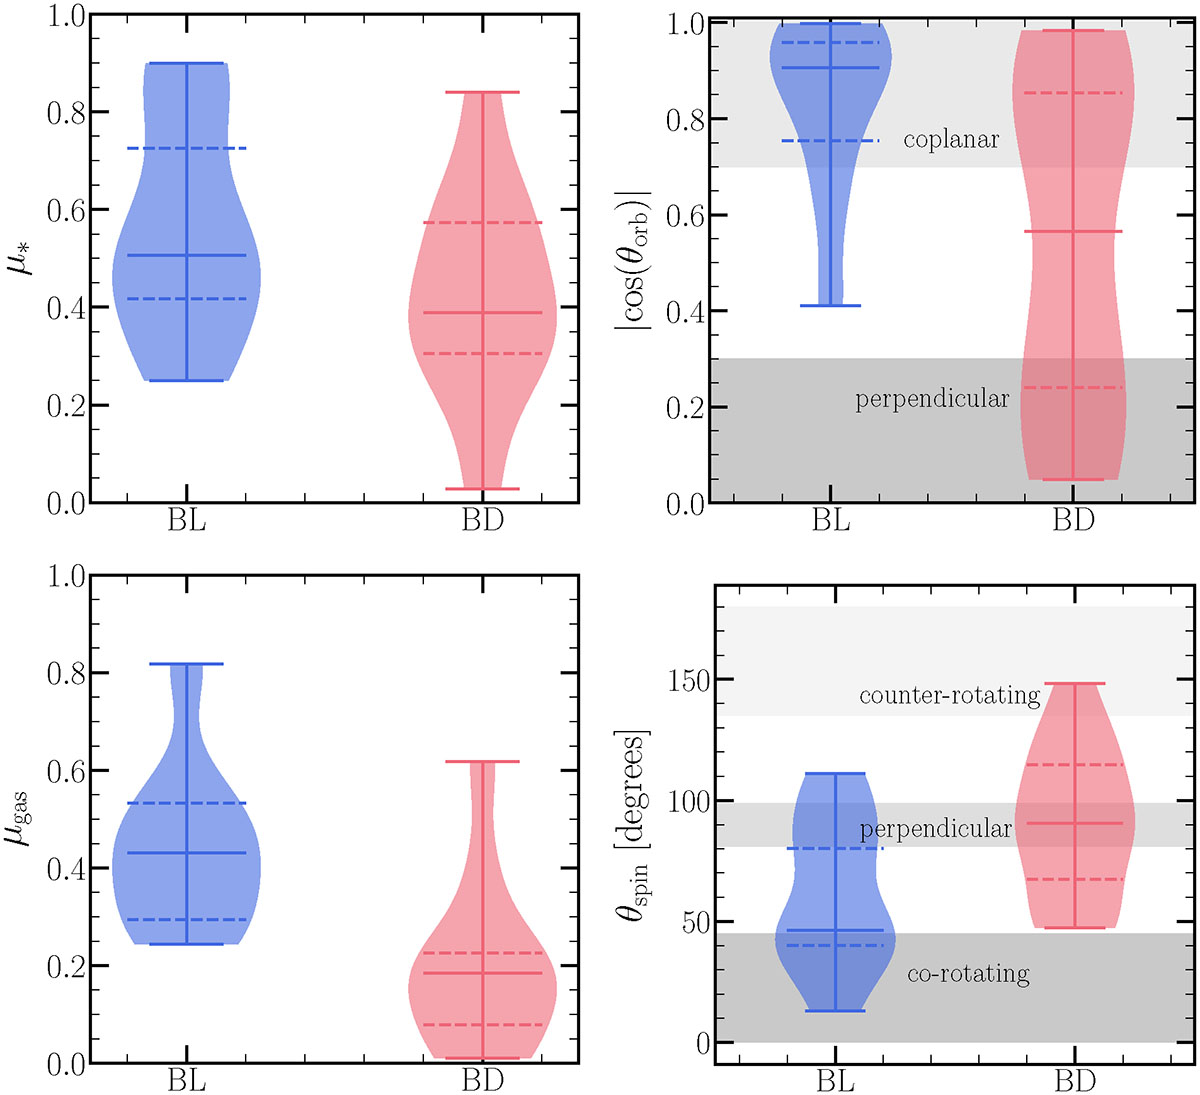
Probability distribution functions of merger properties for BL and BD galaxies. Panels a–d show the distributions of stellar mass ratio, |cos θorb|, gas mass fraction, and cos θspin, respectively, for major mergers (as defined in Section 2.2). Solid and dashed horizontal lines indicate medians and interquartile ranges. Grey hatched regions mark classification thresholds: coplanar mergers have |cos(θorb)| > 0.7; perpendicular ones have |cos(θorb)| ≤ 0.3; corotating mergers satisfy cos(θspin) > 0.7, perpendicular mergers fall in −0.15 < cos(θspin) < 0.15, and counterrotating mergers have cos(θspin) < − 0.7.
Current usage metrics show cumulative count of Article Views (full-text article views including HTML views, PDF and ePub downloads, according to the available data) and Abstracts Views on Vision4Press platform.
Data correspond to usage on the plateform after 2015. The current usage metrics is available 48-96 hours after online publication and is updated daily on week days.
Initial download of the metrics may take a while.