Fig. B.3
Download original image
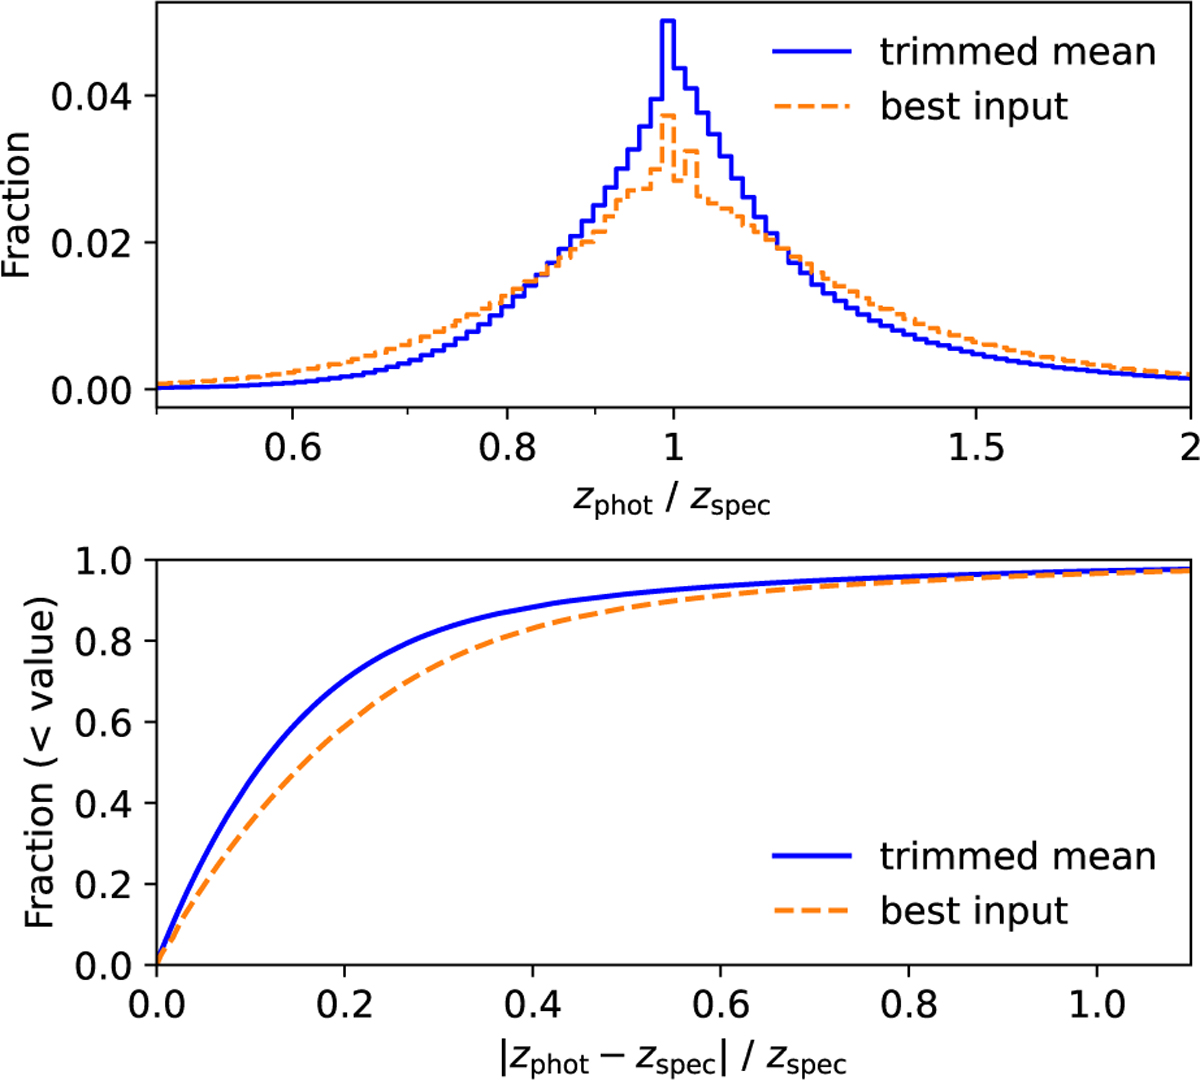
Comparison between photometric and spectroscopic redshifts for galaxies with available zspec. (Top) Distribution of the ratio between the photometric redshift from the preferred catalog ("best input," orange) or the trimmed mean of photometric estimates (blue) and the spectroscopic redshift. (Bottom) Cumulative distribution of the relative difference |zphot − zspec|/zspec.
Current usage metrics show cumulative count of Article Views (full-text article views including HTML views, PDF and ePub downloads, according to the available data) and Abstracts Views on Vision4Press platform.
Data correspond to usage on the plateform after 2015. The current usage metrics is available 48-96 hours after online publication and is updated daily on week days.
Initial download of the metrics may take a while.