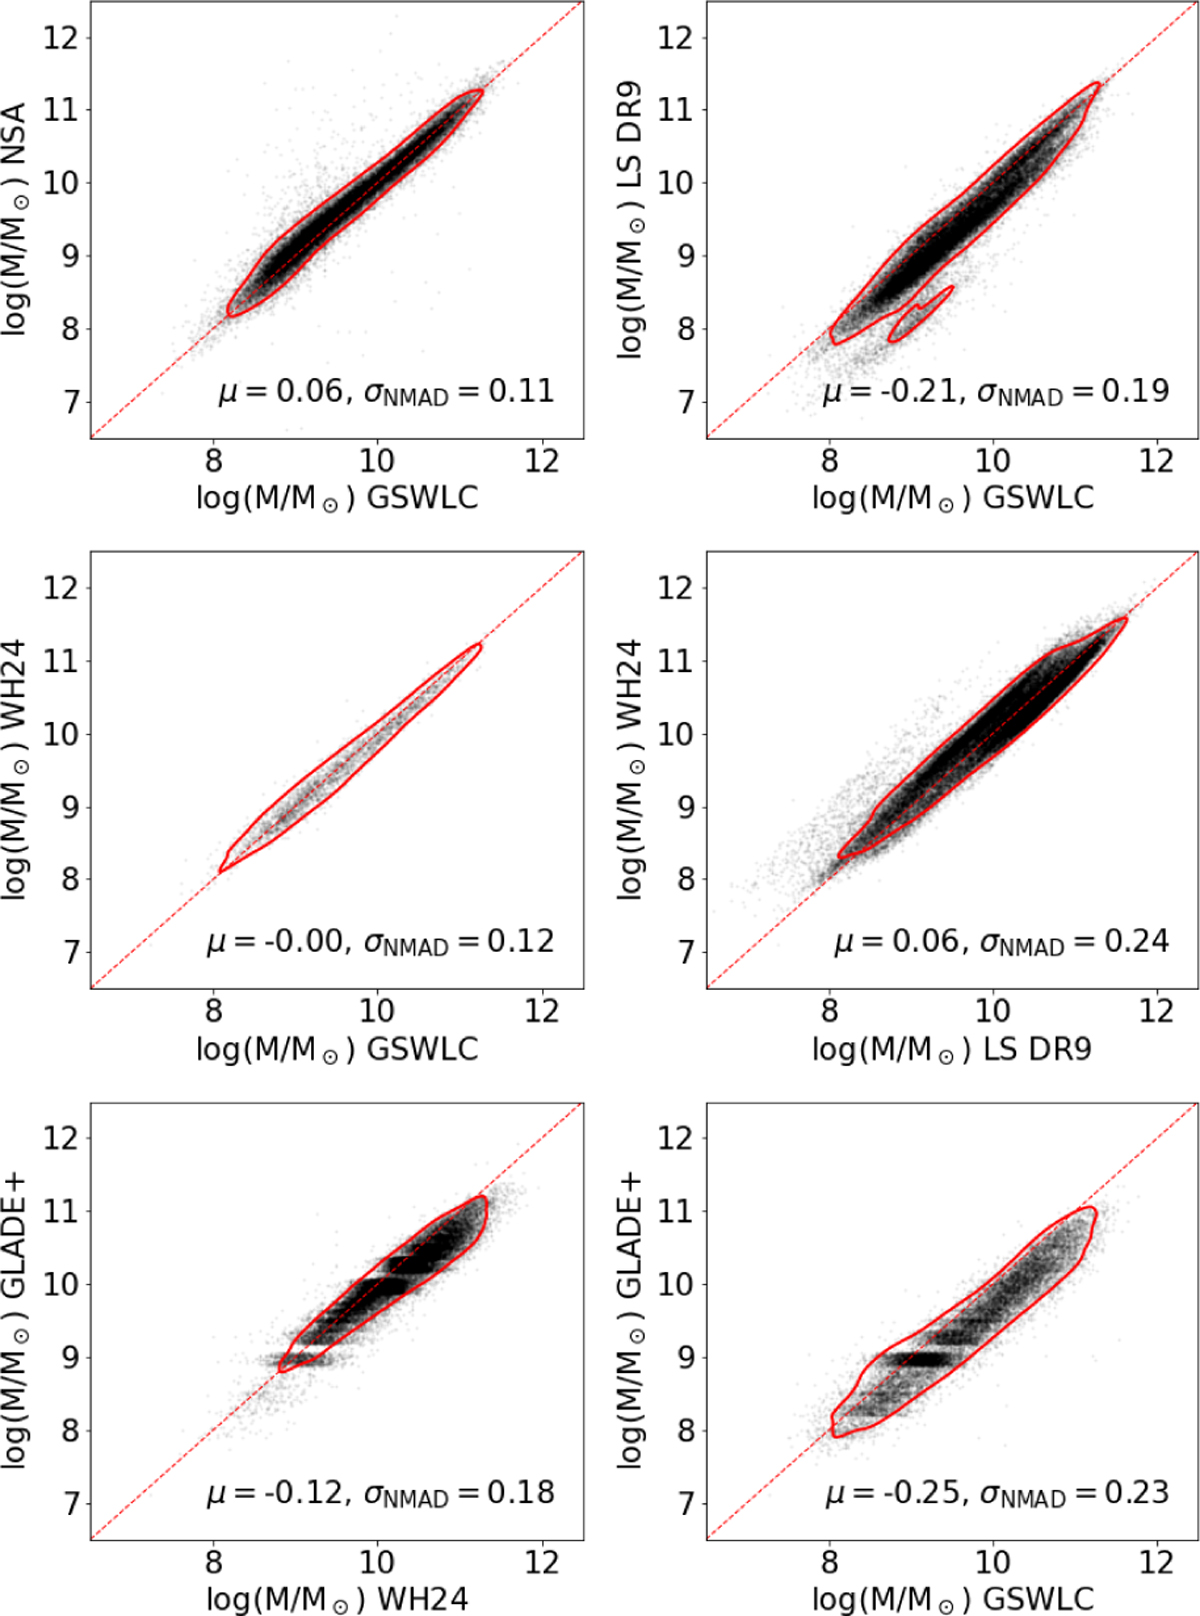
Fig. D.1
Download original image
Comparison between stellar masses of our input catalogs. Row 1: Template-fitting model estimates of GSWLC (Salim et al. 2016), NASA Sloan Atlas (Blanton & Roweis 2007), and LS DR9 galaxies (Zou et al. 2022). Row 2: Photometry-based stellar masses (LS10 galaxies) against template-based estimates. Row 3: GLADE+ stellar masses against reference estimates. Contours encompass 90% of each distribution. The mean difference and NMAD are quoted in legend.
Current usage metrics show cumulative count of Article Views (full-text article views including HTML views, PDF and ePub downloads, according to the available data) and Abstracts Views on Vision4Press platform.
Data correspond to usage on the plateform after 2015. The current usage metrics is available 48-96 hours after online publication and is updated daily on week days.
Initial download of the metrics may take a while.