Fig. 2
Download original image
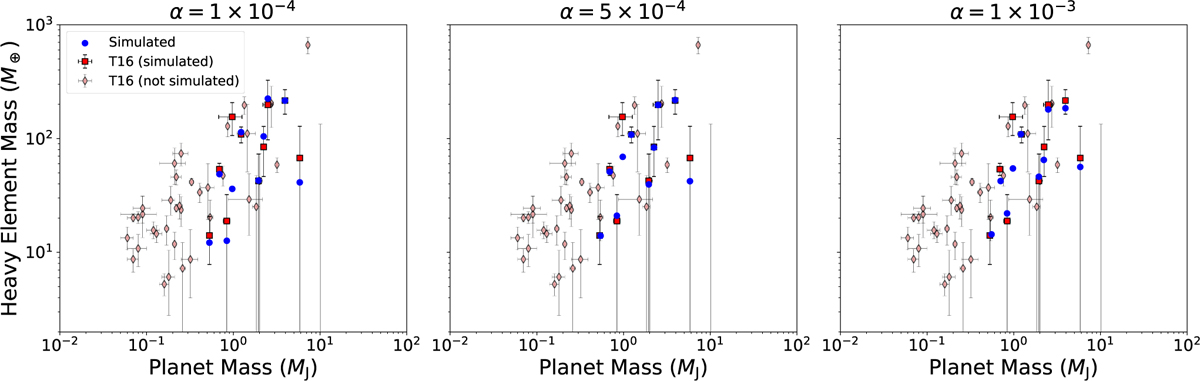
Mass vs heavy element mass relation for the ten simulated planets. Blue points show simulations where the initial formation location matched the observed heavy element mass most closely. Data from Thorngren et al. (2016) are shown in red (T16). Planets that are simulated in this work are plotted as red squares, while those that are not simulated in this work, either because they are less massive than 0.5 MJ or because the stellar chemical abundances of their host star are not included in Teske et al. (2019), are plotted as pale red diamonds.
Current usage metrics show cumulative count of Article Views (full-text article views including HTML views, PDF and ePub downloads, according to the available data) and Abstracts Views on Vision4Press platform.
Data correspond to usage on the plateform after 2015. The current usage metrics is available 48-96 hours after online publication and is updated daily on week days.
Initial download of the metrics may take a while.