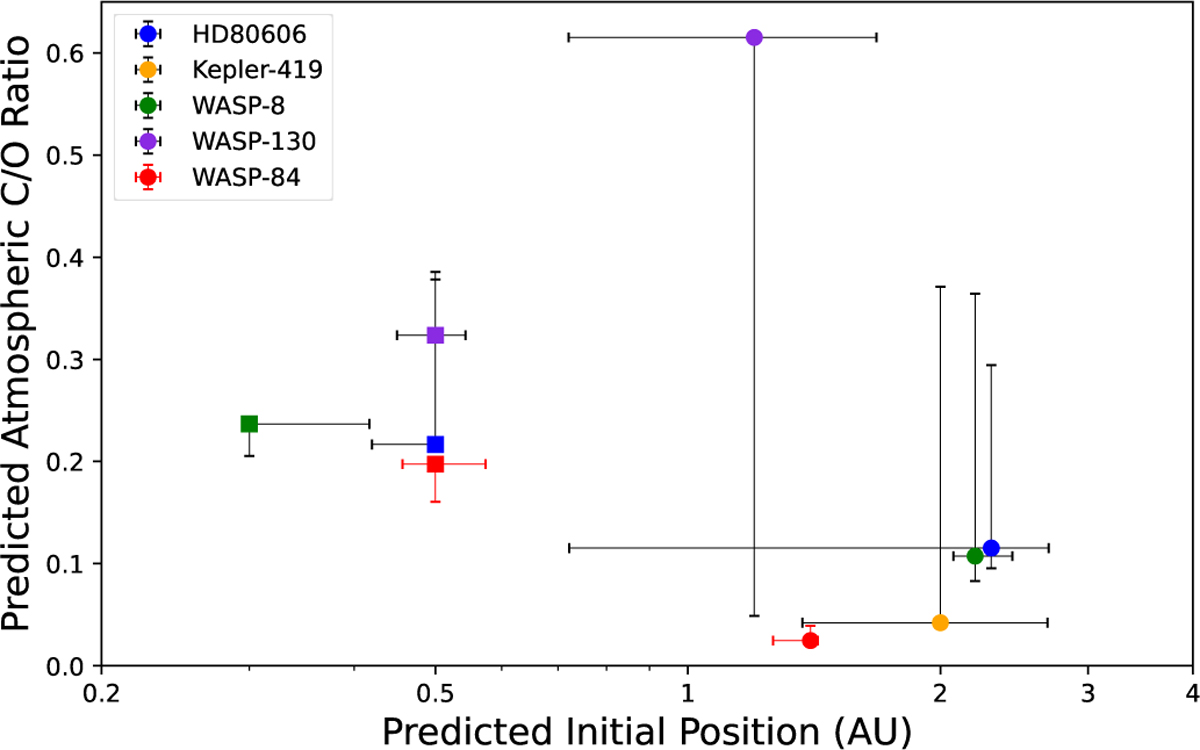
Fig. 5
Download original image
Predicted initial positions that simulate the observed heavy element masses and the corresponding predicted C/O ratios for the five simulated planets whose heavy element contents were well constrained. All simulations use α = 1 × 10⁻⁴. Squares (circles) represent the ‘inner’ (‘outer’) formation regions. The points are placed at the initial position that led to the simulations most closely matching the observed heavy element mass. The error bars on the x-axis represent the width of the constrained possible formation regions of each planet, while the error bars on the y-axis show the range in the predicted C/O ratio within each region. WASP-84b is the focus of this work due to its potential observability and is marked with red points and error bars.
Current usage metrics show cumulative count of Article Views (full-text article views including HTML views, PDF and ePub downloads, according to the available data) and Abstracts Views on Vision4Press platform.
Data correspond to usage on the plateform after 2015. The current usage metrics is available 48-96 hours after online publication and is updated daily on week days.
Initial download of the metrics may take a while.