Fig. B.3
Download original image
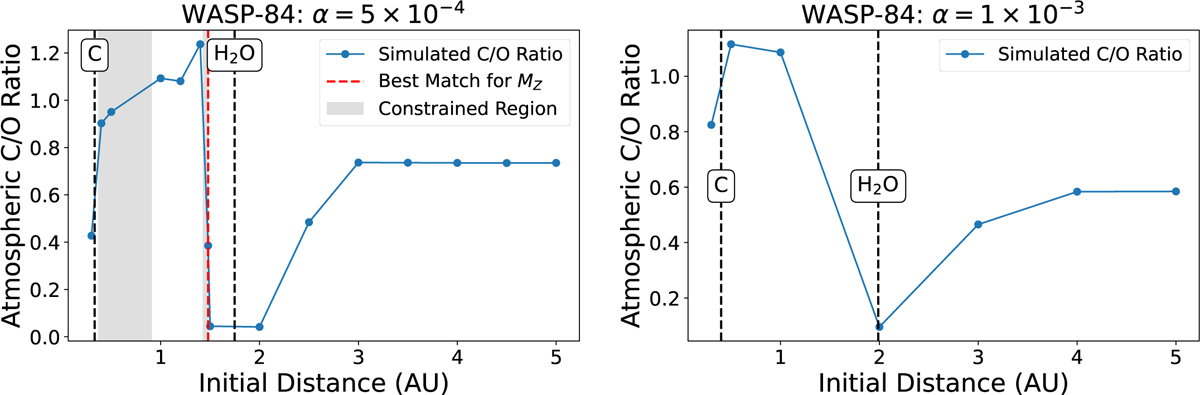
Predicted atmospheric C/O number ratios of the planet simulated in the disc of WASP-84 as a function of initial position for a disc of α = 5 × 10⁻⁴ (left) and α = 1 × 10⁻³ (right). The dashed red line shows the best-fit formation location based on the heavy element mass, and the grey region indicates the constrained range of possible formation locations. H2O and C evaporation fronts are shown as dashed black lines in all panels. No possible formation regions were identified for WASP-84b in a disc of α = 1 × 10⁻³.
Current usage metrics show cumulative count of Article Views (full-text article views including HTML views, PDF and ePub downloads, according to the available data) and Abstracts Views on Vision4Press platform.
Data correspond to usage on the plateform after 2015. The current usage metrics is available 48-96 hours after online publication and is updated daily on week days.
Initial download of the metrics may take a while.