Fig. 1.
Download original image
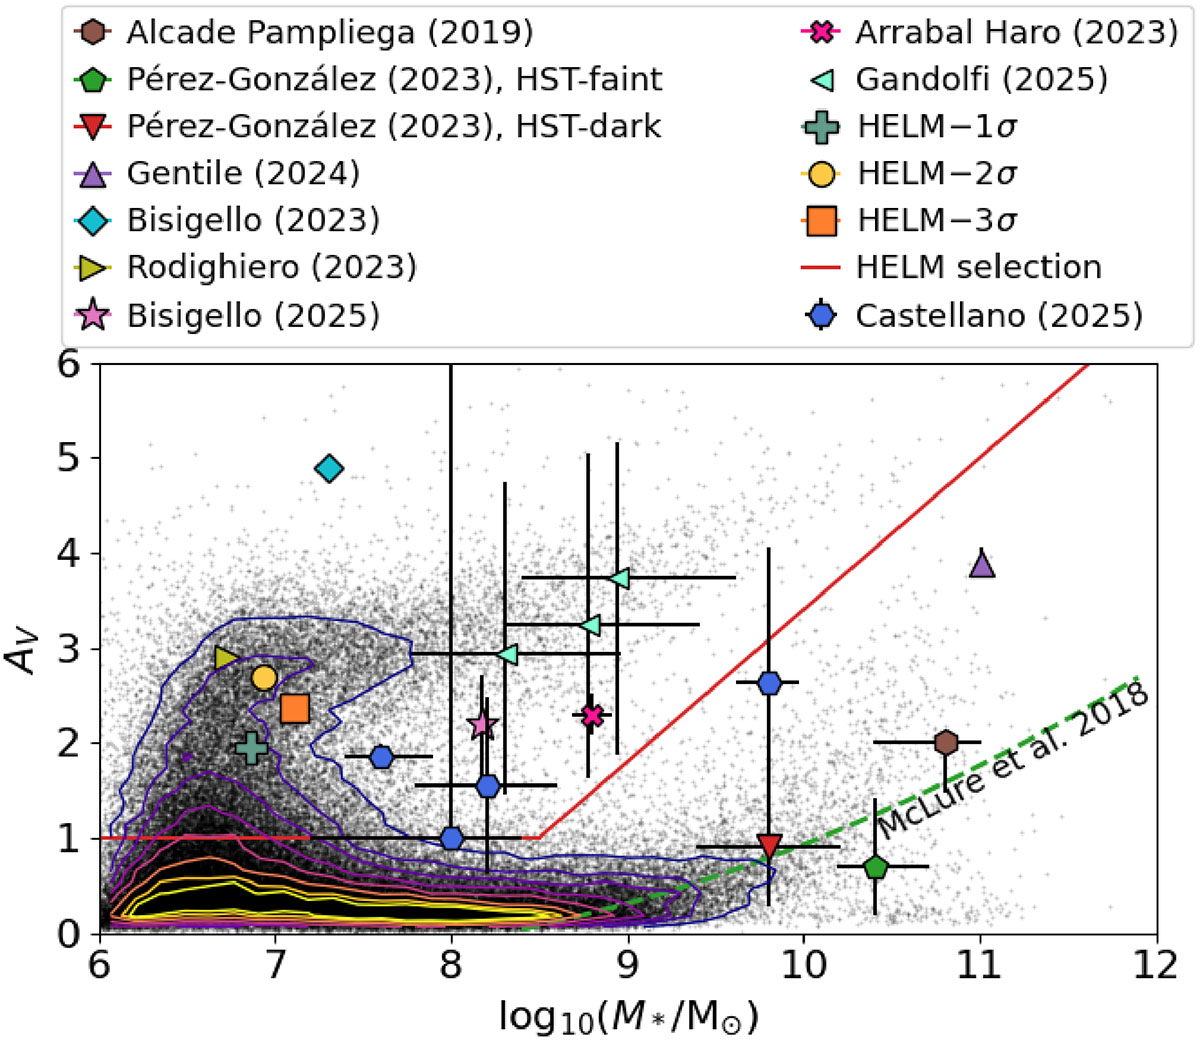
Unexpected population of HELM galaxies, as visible in the stellar mass and dust attenuation plane. Black dots represent the entire CEERS sample (before any selection), derived from the first SED fitting run described in Sect. 2.2 and considering the median value of both Av and stellar mass. Contour lines show the 20 (yellow) to 90% (dark blue) of the distribution, in steps of 10%. Coloured symbols show other samples of dusty objects from the literature (Alcalde Pampliega et al. 2019; Pérez-González et al. 2023; Gentile et al. 2024; Rodighiero et al. 2023; Bisigello et al. 2023; Gandolfi et al. 2025; Castellano et al. 2025; Arrabal Haro et al. 2023b) and the one analysed in this paper (see Sect. 2.3). Bisigello et al. (2025) is a HELM galaxy confirmed spectroscopically and is also part of the HELM-2σ sample, while the source by Castellano et al. (2025) has been confirmed spectroscopically but is on another field. The dashed green line shows the known relation between dust attenuation and stellar mass (McLure et al. 2018) derived at 2 < z < 3, while the solid red line shows the selection criterion of HELM sources.
Current usage metrics show cumulative count of Article Views (full-text article views including HTML views, PDF and ePub downloads, according to the available data) and Abstracts Views on Vision4Press platform.
Data correspond to usage on the plateform after 2015. The current usage metrics is available 48-96 hours after online publication and is updated daily on week days.
Initial download of the metrics may take a while.