Fig. 2
Download original image
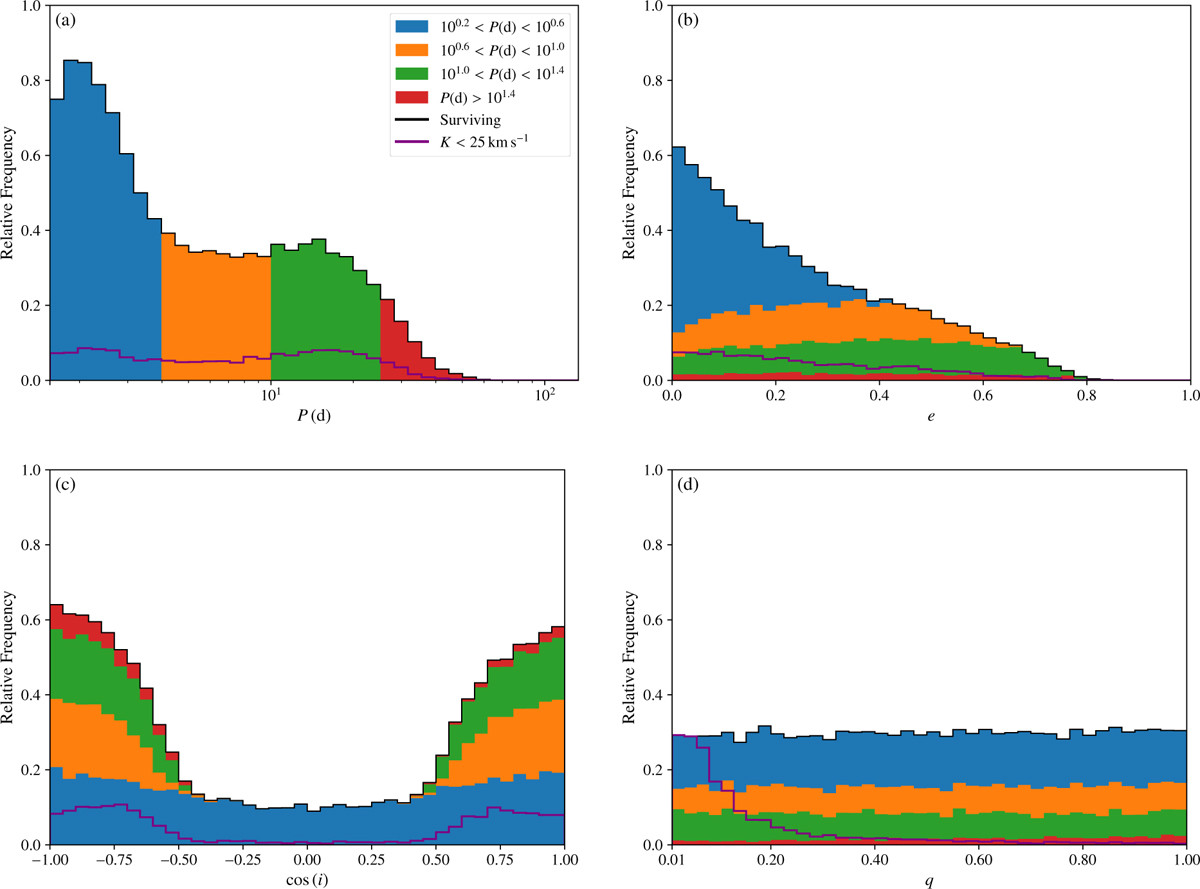
Histograms of the relative frequency distribution of the surviving binary’s main orbital parameters. We show the orbital period (a), the eccentricity (b), the mutual inclination (c), and the mass ratio (d). The black line gives the total distribution of the surviving systems, while the purple line represents the fraction that would have remained imperceptible to current radial-velocity measurements (Eq. (3)). The colour code corresponds to different ranges of orbital periods (a).
Current usage metrics show cumulative count of Article Views (full-text article views including HTML views, PDF and ePub downloads, according to the available data) and Abstracts Views on Vision4Press platform.
Data correspond to usage on the plateform after 2015. The current usage metrics is available 48-96 hours after online publication and is updated daily on week days.
Initial download of the metrics may take a while.