Fig. C.1
Download original image
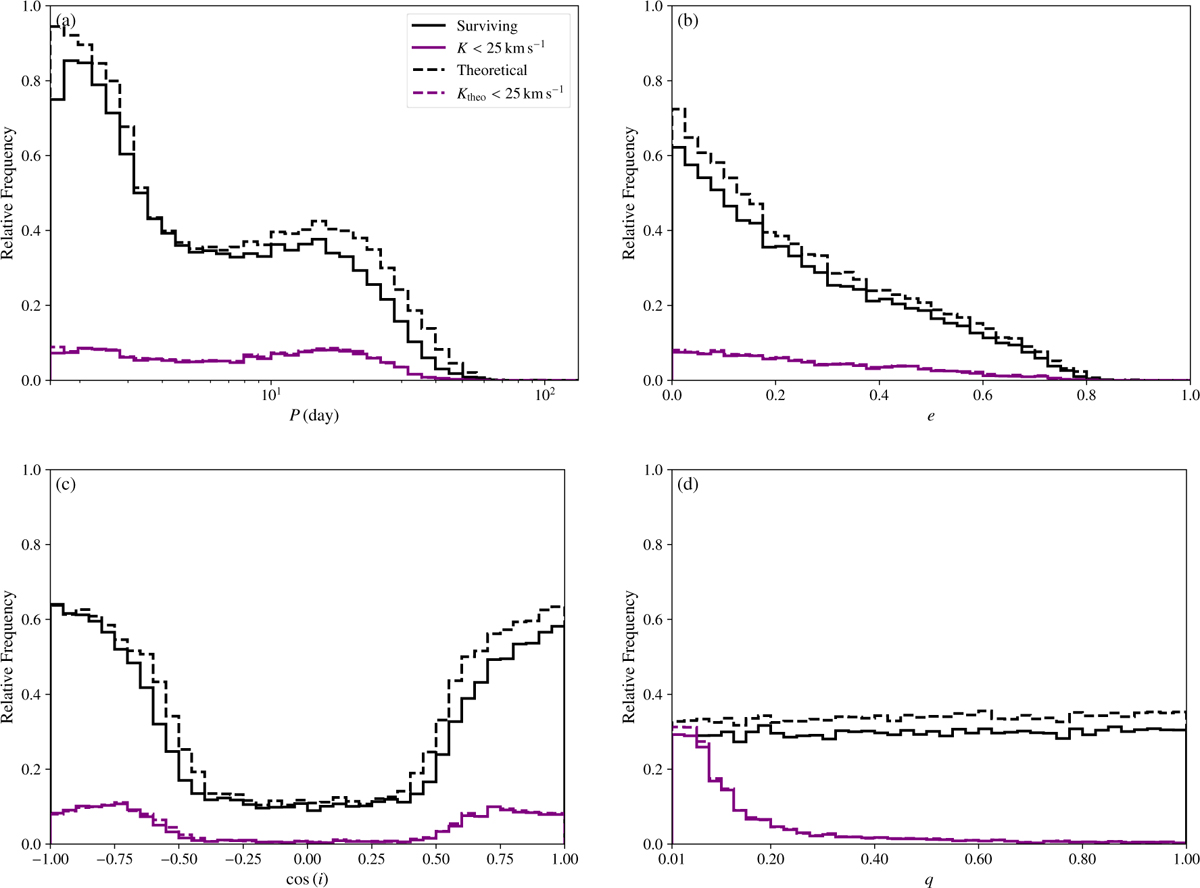
Histograms of the relative frequency distribution of the main orbital parameters of surviving binaries. The dashed lines indicate the analytical prediction of surviving binaries based on simple criteria (Eqs. (C.7) and (C.9)), while the solid lines depict the results from the three-body numerical simulations (Fig. 2). We show the orbital period (a), eccentricity (b), mutual inclination (c), and mass ratio (d).
Current usage metrics show cumulative count of Article Views (full-text article views including HTML views, PDF and ePub downloads, according to the available data) and Abstracts Views on Vision4Press platform.
Data correspond to usage on the plateform after 2015. The current usage metrics is available 48-96 hours after online publication and is updated daily on week days.
Initial download of the metrics may take a while.