Fig. 13
Download original image
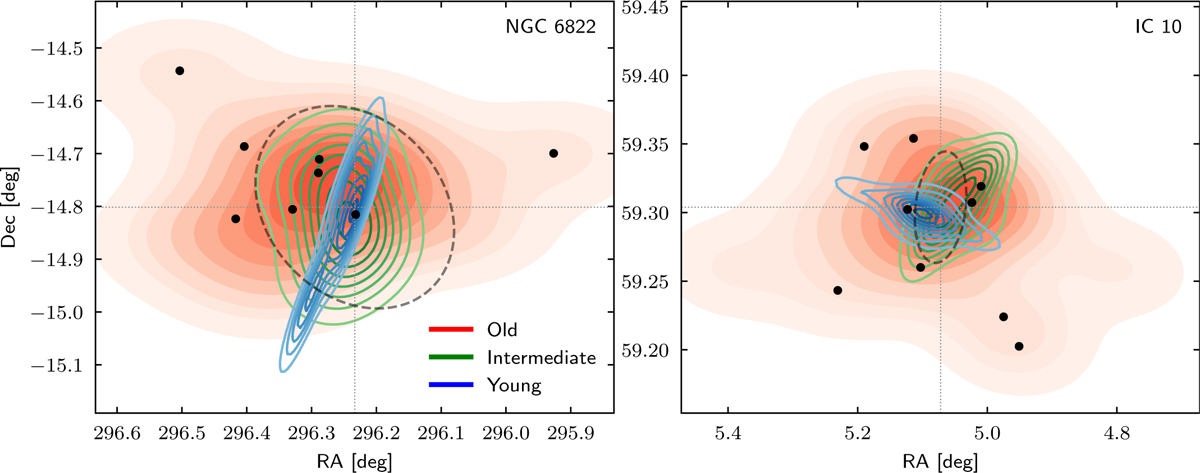
Kernel density estimation contour plots showing the spatial distribution of clusters in NGC 6822 (left) and IC 10 (right). Clusters are grouped by age: old (red), intermediate (green) and young (blue). The contours represent the density of clusters at their location within each galaxy. Old clusters are displayed with filled contours to enhance contrast against the other populations, making them easier to distinguish. Also plotted are grid lines marking the nominal centre of each galaxy (Sibbons et al. 2012; Gerbrandt et al. 2015) and the positions of candidate GCs in black (see Sect. 7.6). Note that there are 3 GCs in NGC 6822 which lie outside the Euclid FOV and are not shown here. Grey dashed ellipses, representing each galaxy’s half-light radius with the appropriate ellipticity and position angle, are overlaid (McConnachie 2012; Higgs et al. 2021; Jarrett et al. 2003).
Current usage metrics show cumulative count of Article Views (full-text article views including HTML views, PDF and ePub downloads, according to the available data) and Abstracts Views on Vision4Press platform.
Data correspond to usage on the plateform after 2015. The current usage metrics is available 48-96 hours after online publication and is updated daily on week days.
Initial download of the metrics may take a while.