Fig. 14
Download original image
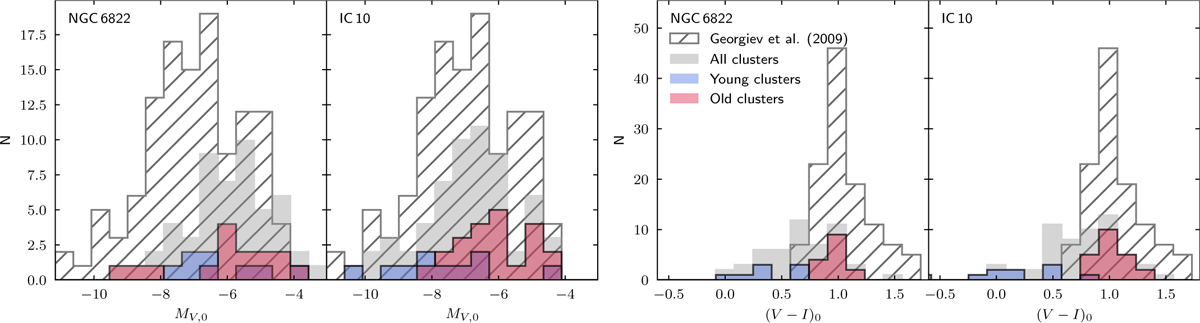
Left panels: distributions of extinction-corrected absolute V-band magnitudes for our sample of clusters. The overall distribution is shown as well as the luminosity function split into young (blue) and old (red) age bins. We also show a sample of GCs in more distant dIrr galaxies, taken from Georgiev et al. (2009). Right panels: the same but for the (V − I)0 colour distributions.
Current usage metrics show cumulative count of Article Views (full-text article views including HTML views, PDF and ePub downloads, according to the available data) and Abstracts Views on Vision4Press platform.
Data correspond to usage on the plateform after 2015. The current usage metrics is available 48-96 hours after online publication and is updated daily on week days.
Initial download of the metrics may take a while.