Fig. 19
Download original image
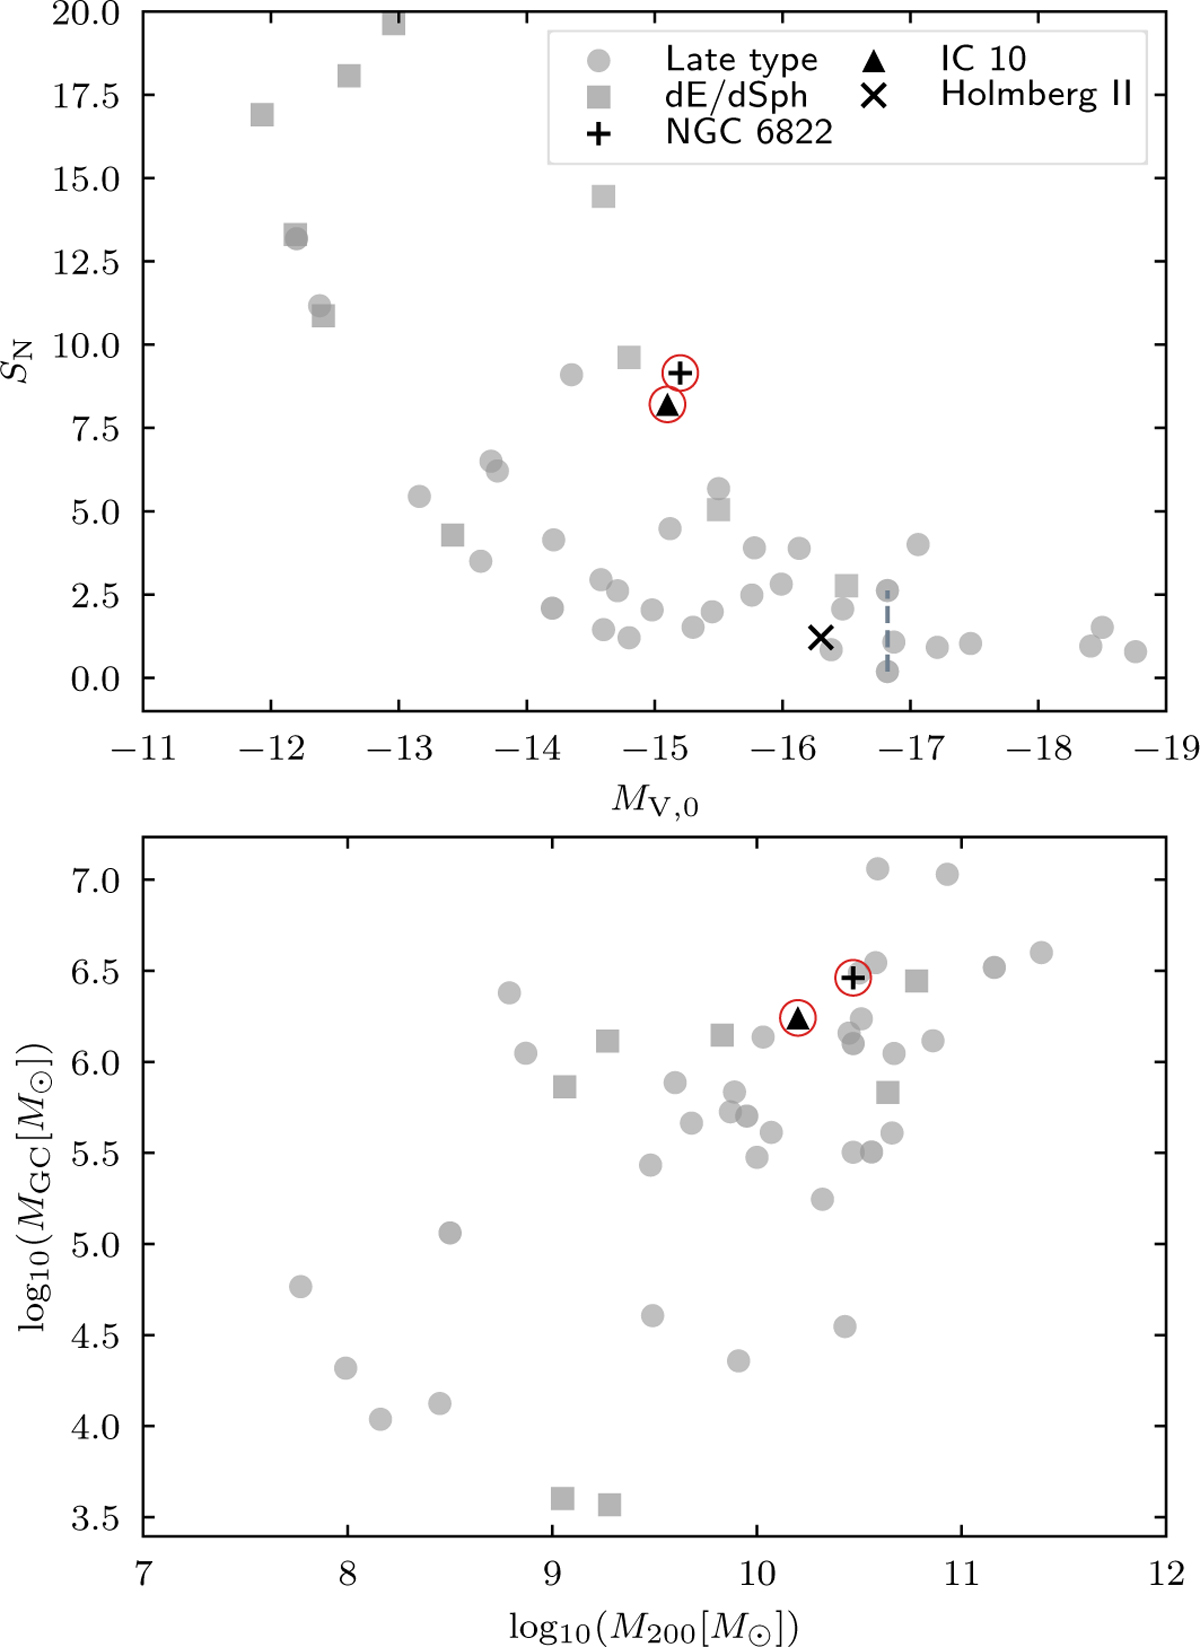
Top: the GC specific frequency SN versus absolute V-band magnitude MV for nearby dwarf galaxies. NGC 6822 and IC 10 are shown by plus and triangle symbols enclosed in red circles. Each galaxy’s NGC is calculated from the number of clusters that are class 1 or 2 with ages larger than 5 Gyr and Z/Z⊙ ≤ 0.2. The grey filled circles and squares represent a sample of LG and late-type galaxies taken from Forbes et al. (2018b). Bottom: the GC system mass-halo mass relation, where the halo mass is represented by M200. The symbols are the same as in the top panel.
Current usage metrics show cumulative count of Article Views (full-text article views including HTML views, PDF and ePub downloads, according to the available data) and Abstracts Views on Vision4Press platform.
Data correspond to usage on the plateform after 2015. The current usage metrics is available 48-96 hours after online publication and is updated daily on week days.
Initial download of the metrics may take a while.