Open Access
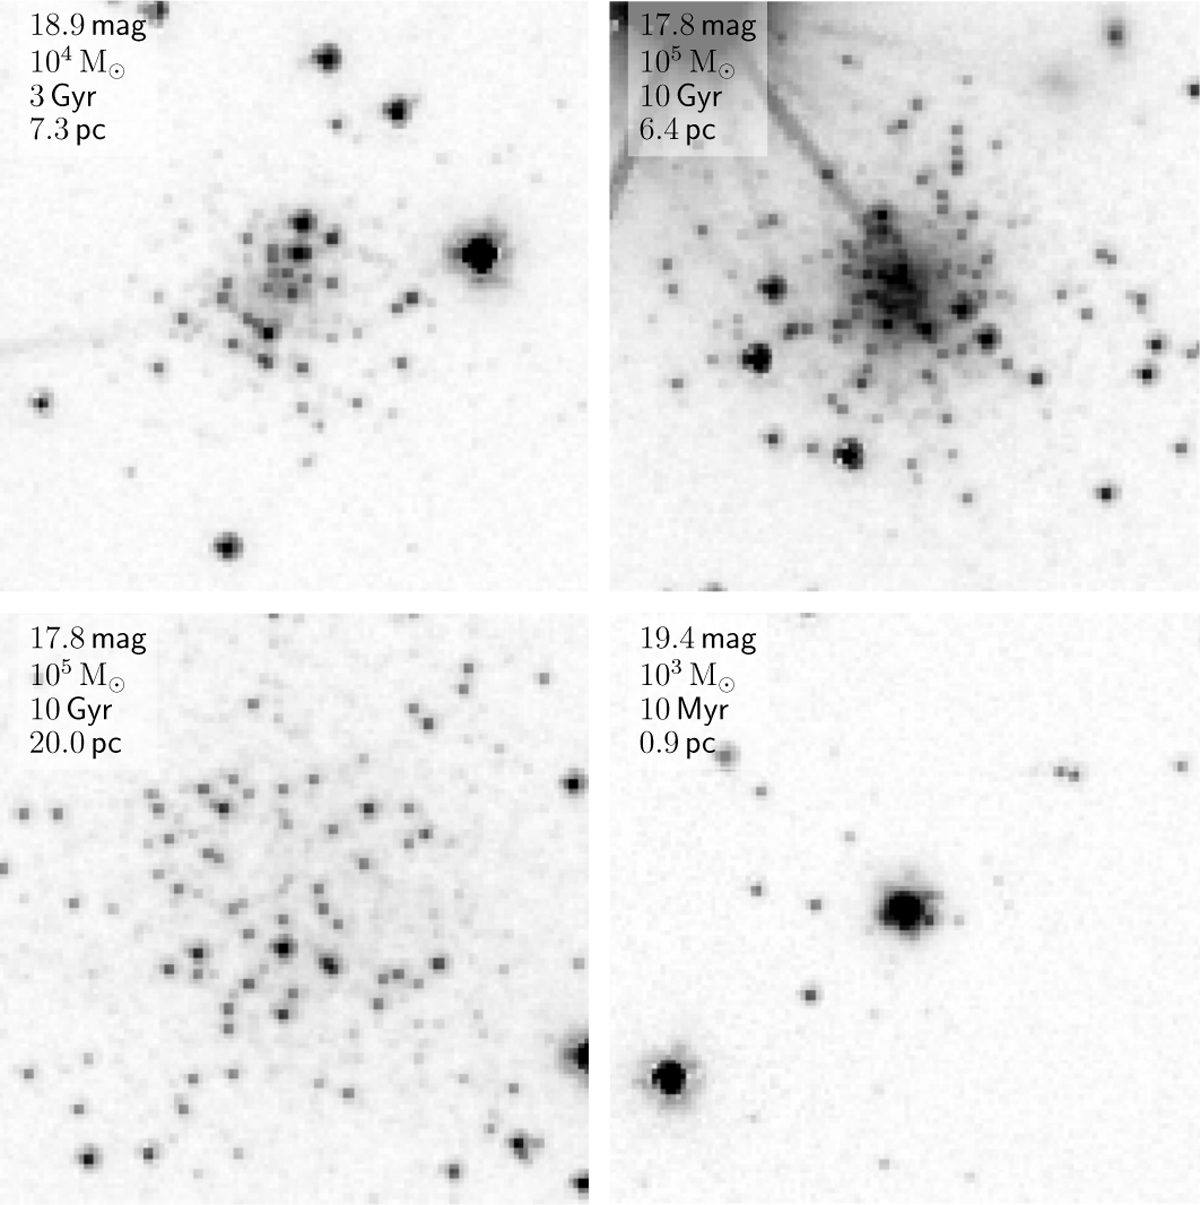
Fig. 4
Download original image
Synthetic clusters displayed in asinh scale, placed within the outermost regions of the IC 10 IE image. Each cutout is 12 arcseconds on the side with apparent IE magnitude, age, and half-light radii displayed.
Current usage metrics show cumulative count of Article Views (full-text article views including HTML views, PDF and ePub downloads, according to the available data) and Abstracts Views on Vision4Press platform.
Data correspond to usage on the plateform after 2015. The current usage metrics is available 48-96 hours after online publication and is updated daily on week days.
Initial download of the metrics may take a while.