Fig. 6
Download original image
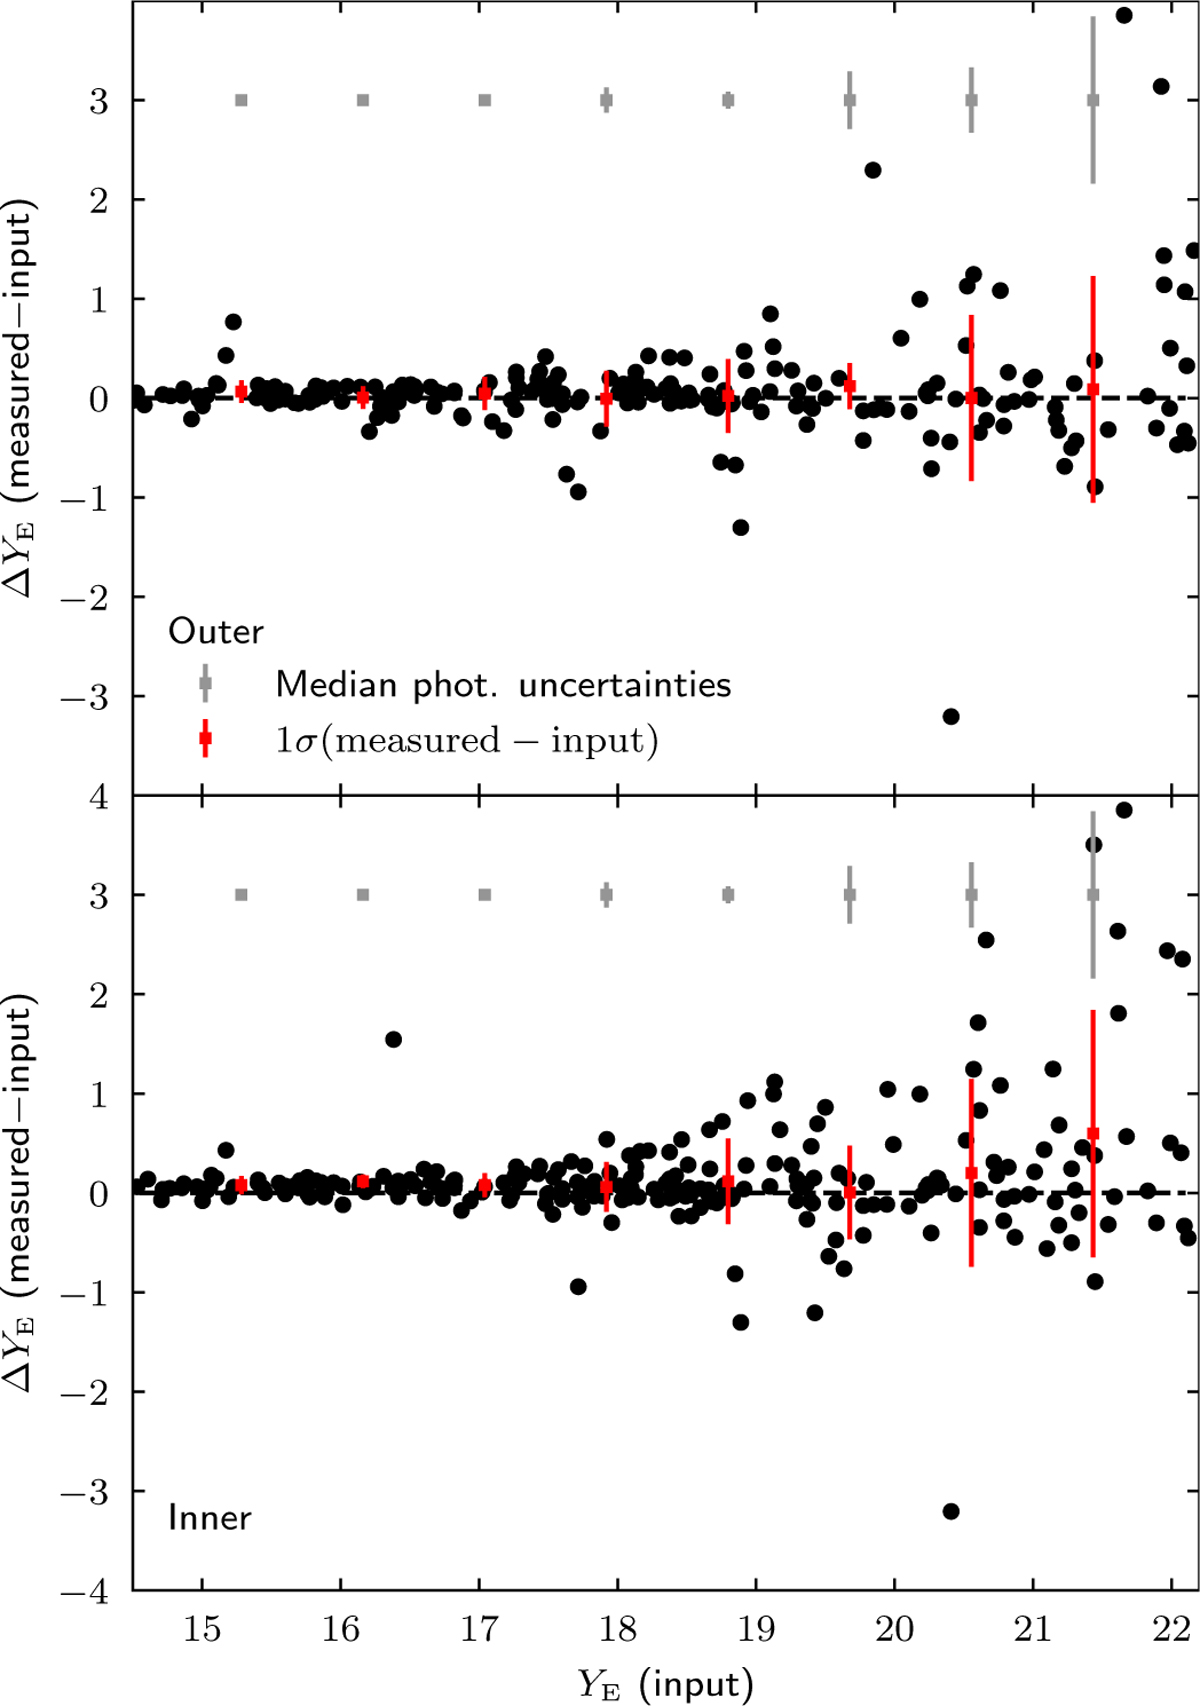
Input versus measured minus input YE-band magnitudes in the outer (top) and inner (bottom) regions of IC 10 using synthetic clusters produced with a Moffat profile and PARSEC isochrones. The dashed line indicates an offset of zero. Also plotted, for each magnitude bin, are the mean offsets with associated standard deviations (red) and, for comparison, the median cluster sample photometric uncertainties placed above at a ΔYE value of 3 (grey).
Current usage metrics show cumulative count of Article Views (full-text article views including HTML views, PDF and ePub downloads, according to the available data) and Abstracts Views on Vision4Press platform.
Data correspond to usage on the plateform after 2015. The current usage metrics is available 48-96 hours after online publication and is updated daily on week days.
Initial download of the metrics may take a while.