Fig. 7
Download original image
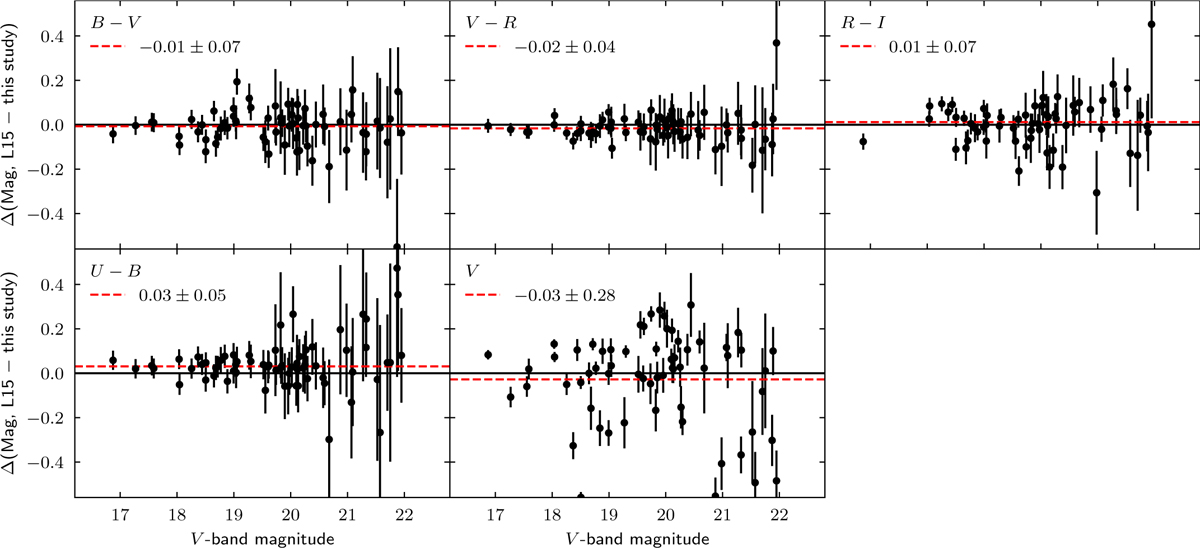
Comparison of our UBVRI photometry to that of L15, using their catalogue of 66 clusters in IC 10. No extinction corrections have been applied. Error bars reflect the combination of L15 and our photometry uncertainties. The red dashed line is the weighted mean offset (indicated in the top left alongside the associated standard deviation), while the black line indicates an offset of zero.
Current usage metrics show cumulative count of Article Views (full-text article views including HTML views, PDF and ePub downloads, according to the available data) and Abstracts Views on Vision4Press platform.
Data correspond to usage on the plateform after 2015. The current usage metrics is available 48-96 hours after online publication and is updated daily on week days.
Initial download of the metrics may take a while.