Fig. 2
Download original image
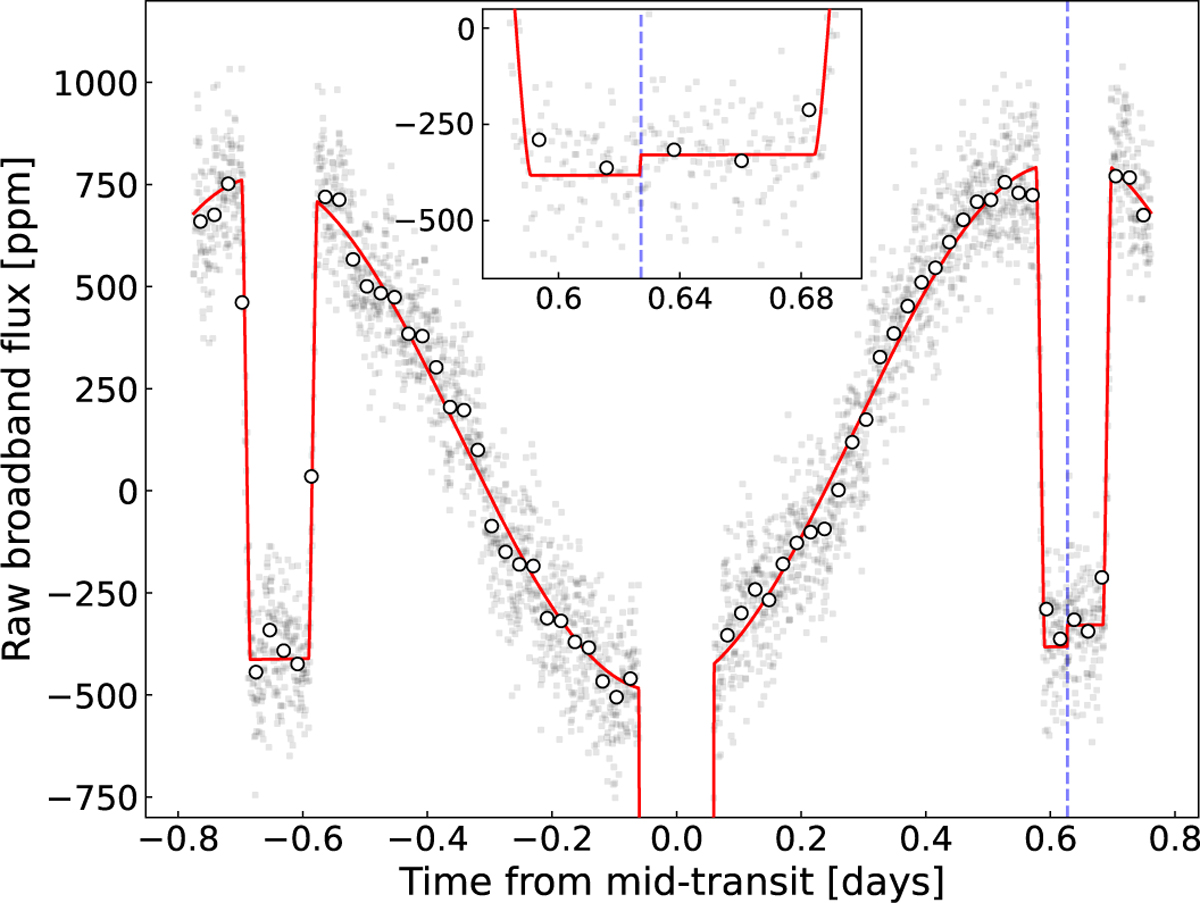
Observed NIRISS/SOSS raw white-light phase curve of WASP-121b and model fit. The data are indicated as grey points (50 integration bins shown as white dots for clarity), with the combined astrophysical and systematics model shown in red. The tilt event occurring during the second eclipse (zoom in shown in the inset panel) is marked by the dashed blue line.
Current usage metrics show cumulative count of Article Views (full-text article views including HTML views, PDF and ePub downloads, according to the available data) and Abstracts Views on Vision4Press platform.
Data correspond to usage on the plateform after 2015. The current usage metrics is available 48-96 hours after online publication and is updated daily on week days.
Initial download of the metrics may take a while.