Fig. 5
Download original image
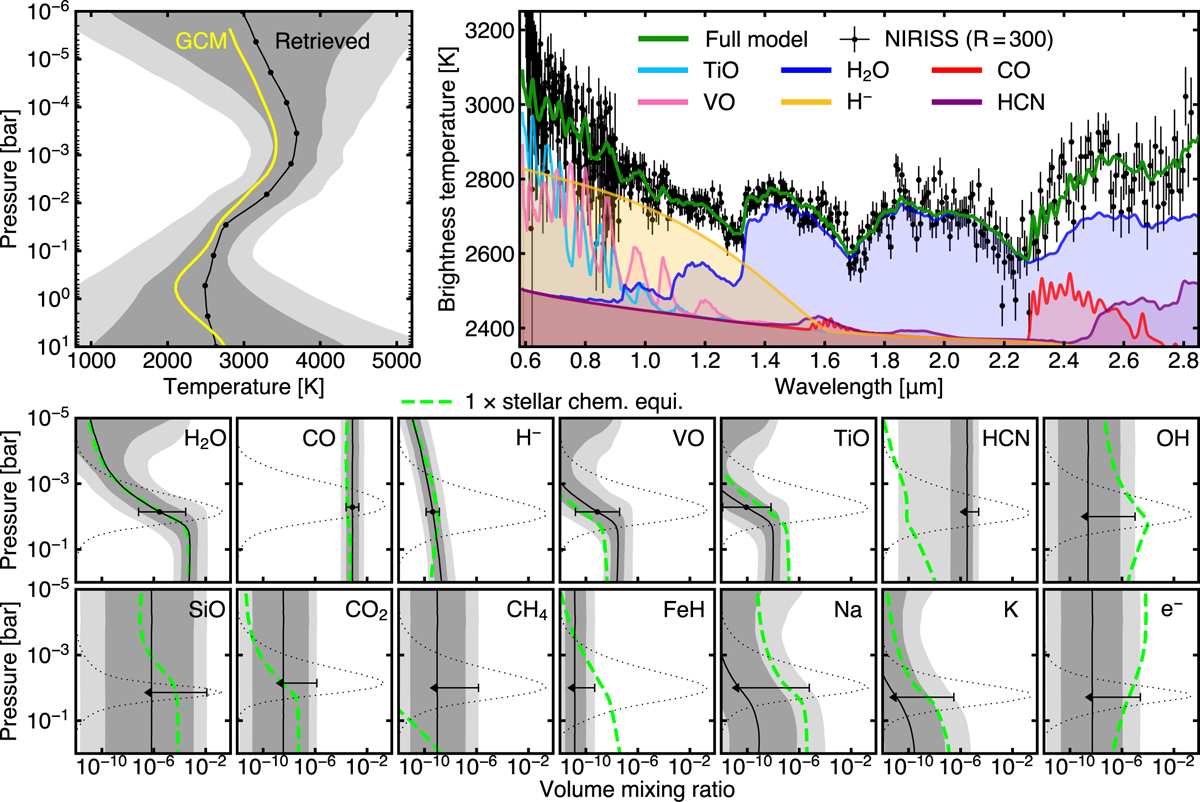
Results overview for the WASP-121b NIRISS SOSS eclipse hybrid free retrieval including parameterised thermal dissociation. Top left: retrieved day-side vertical temperature structure (black line: median, grey contours: 1 and 2 σ bounds) compared to the average TP profile at mid-eclipse of a fiducial GCM model (Parmentier et al. 2018, yellow line). Top right: measured day-side brightness temperature of WASP-121b (black points) compared to the best fit atmospheric model (solid green line). Opacity contributions from individual species are shown in colour. Multiple H2O emission bands can be seen, as well as contribution from CO around 2.4 µm. At shorter wavelengths, H−, VO, and TiO are necessary to match the rise in brightness temperature (note that an albedo of zero was assumed for this retrieval). Bottom: each panel shows the retrieved abundance profiles for an individual species fitted in the retrieval (solid black line: median, grey contours: 1 and 2 σ bounds). Average contribution functions (dotted black line) show the pressure level probed by each species. The abundance profiles predicted from an equilibrium chemistry model assuming the median TP profile and a stellar-like composition (Evans-Soma et al. 2025) are also shown for comparison (dashed lime green lines). Constrained abundances are obtained for H2O, CO, VO, TiO, and H−, with only upper limits obtained for the other species. Error bars (1σ) or upper limits (2σ) are shown at the approximate average pressure probed (peak of the contribution function).
Current usage metrics show cumulative count of Article Views (full-text article views including HTML views, PDF and ePub downloads, according to the available data) and Abstracts Views on Vision4Press platform.
Data correspond to usage on the plateform after 2015. The current usage metrics is available 48-96 hours after online publication and is updated daily on week days.
Initial download of the metrics may take a while.