Fig. A.1.
Download original image
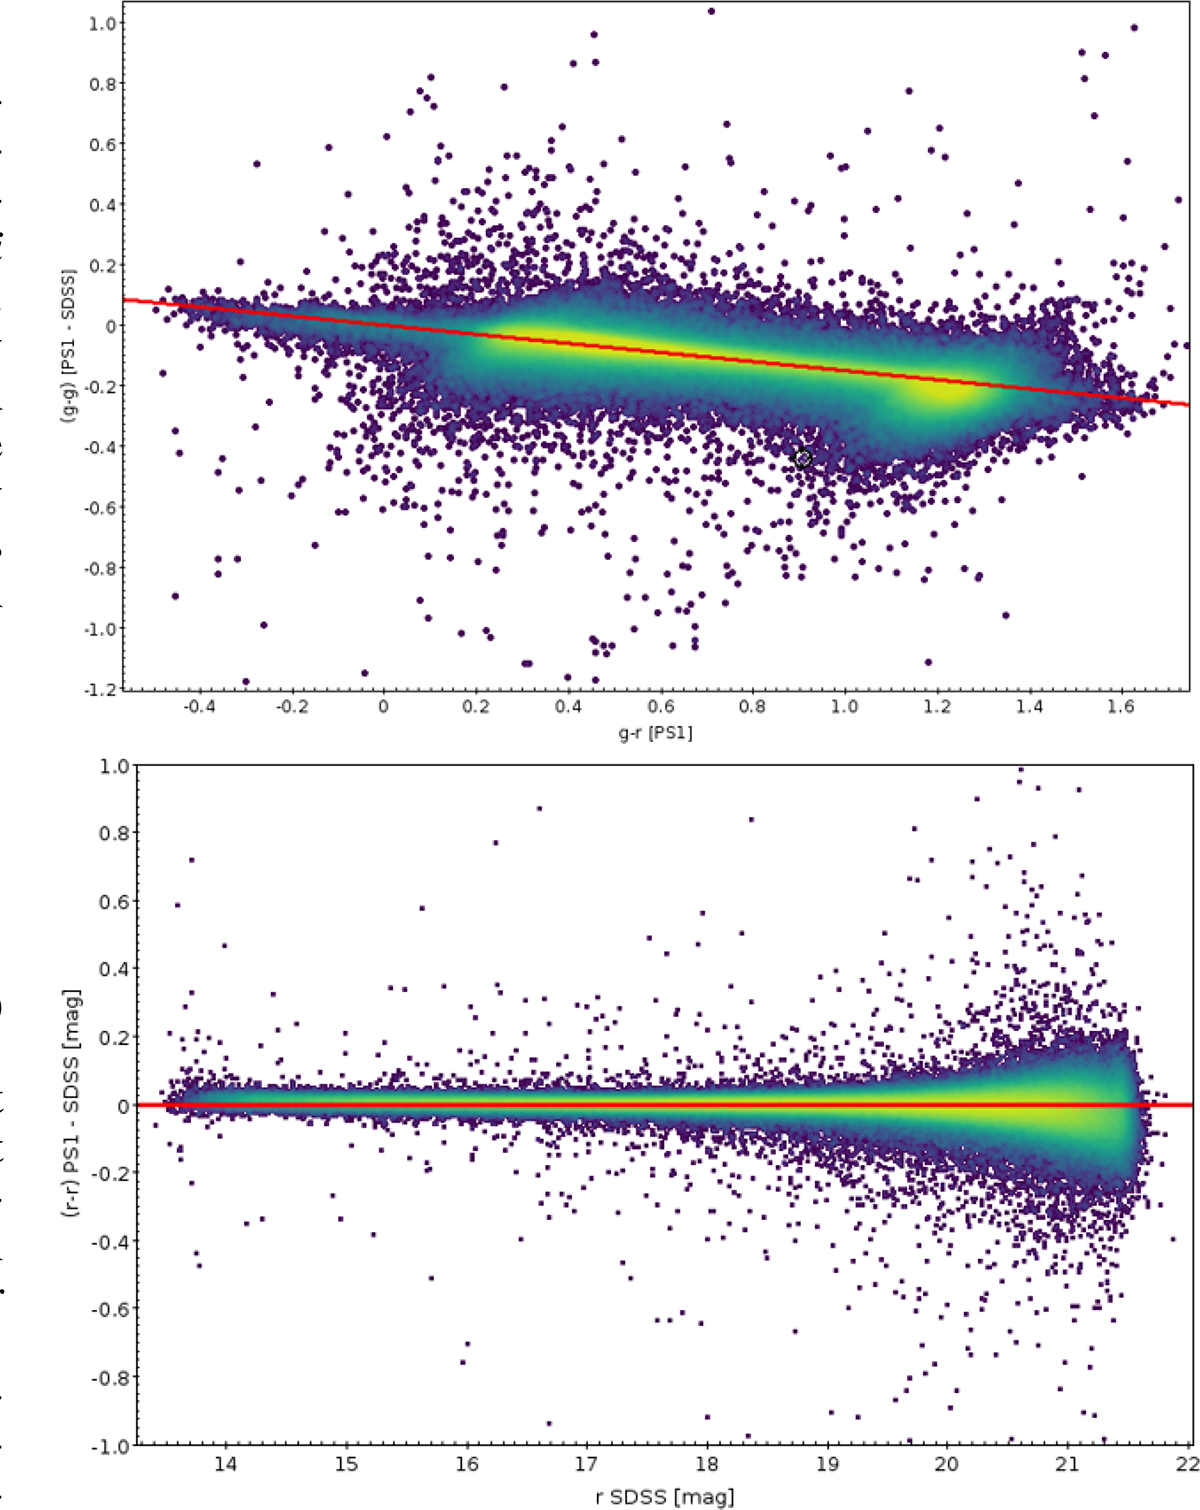
Colour-magnitude diagrams with PS1 and SDSS magnitudes of non-variable stars. The points are colour-coded by density, with yellow indicating regions of higher point density, and darker areas representing lower-density regions. The upper panel shows the linear correction applied to the g band, while the lower panel demonstrates that the r filters are nearly identical, requiring no correction.
Current usage metrics show cumulative count of Article Views (full-text article views including HTML views, PDF and ePub downloads, according to the available data) and Abstracts Views on Vision4Press platform.
Data correspond to usage on the plateform after 2015. The current usage metrics is available 48-96 hours after online publication and is updated daily on week days.
Initial download of the metrics may take a while.