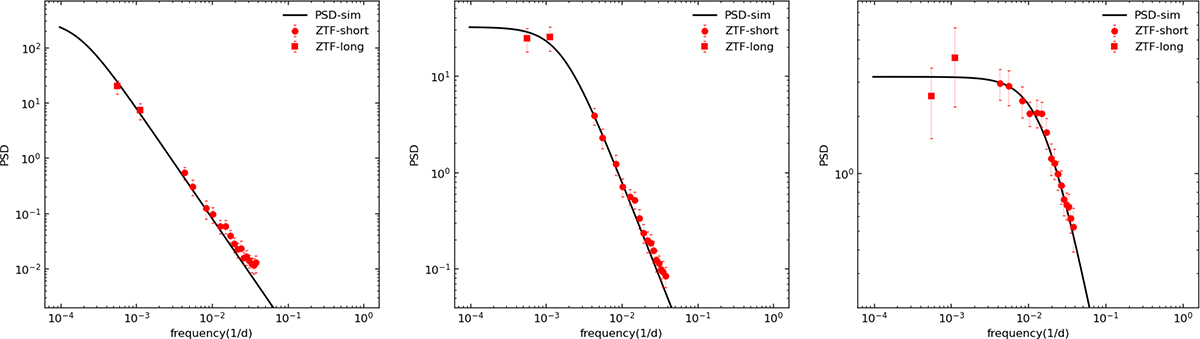
Fig. B.1.
Download original image
Ensemble power spectra of simulated DRW light curves with the same observing pattern as the ZTF data. Red circles and squares show the measured PSDs at high and low frequencies, respectively. Solid black line refers to the power spectrum associated to a DRW model with σ = 0.28, and log τ = 3 (left panel), log τ = 3 (middle panel), and log τ = 1 (right panel).
Current usage metrics show cumulative count of Article Views (full-text article views including HTML views, PDF and ePub downloads, according to the available data) and Abstracts Views on Vision4Press platform.
Data correspond to usage on the plateform after 2015. The current usage metrics is available 48-96 hours after online publication and is updated daily on week days.
Initial download of the metrics may take a while.