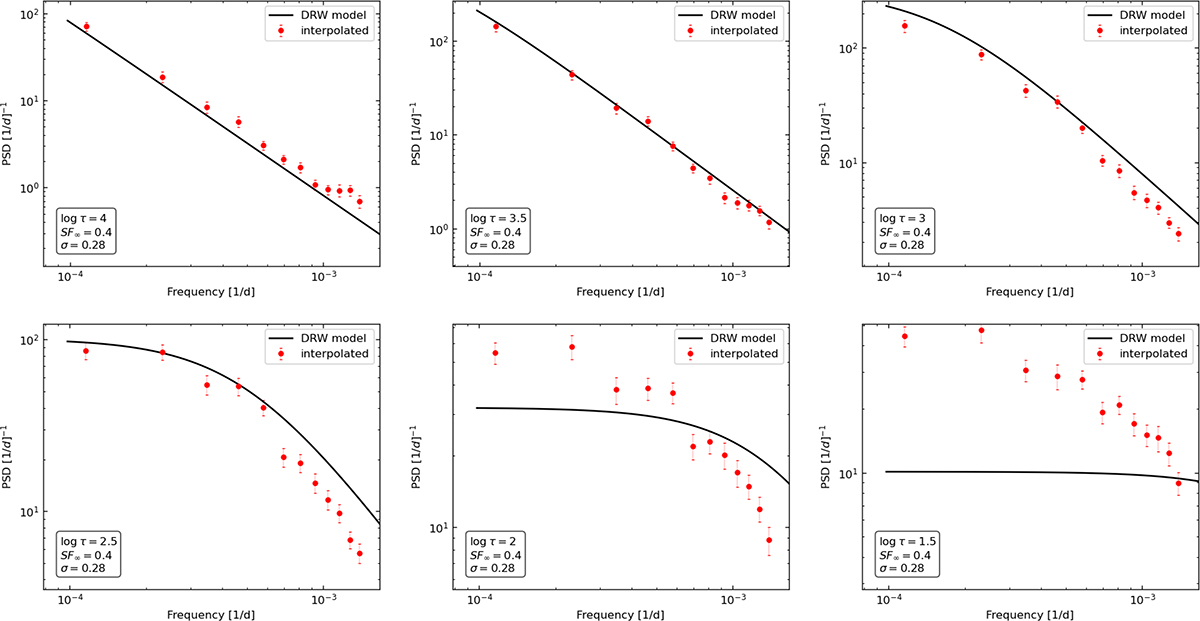
Fig. C.2.
Download original image
Ensemble power spectra of simulated DRW light curves with the same observing pattern as combined SDSS+PS1+Gaia+ZTF data, interpolated via RBFs. Red points show the measured power spectral densities, while the black solid line refers to the power spectrum associated to the DRW model. Each panel has DRW light curves with different damping timescales, as listed on the figures, probe regions where the interpolation falls before, within or after the break.
Current usage metrics show cumulative count of Article Views (full-text article views including HTML views, PDF and ePub downloads, according to the available data) and Abstracts Views on Vision4Press platform.
Data correspond to usage on the plateform after 2015. The current usage metrics is available 48-96 hours after online publication and is updated daily on week days.
Initial download of the metrics may take a while.