Fig. 3.
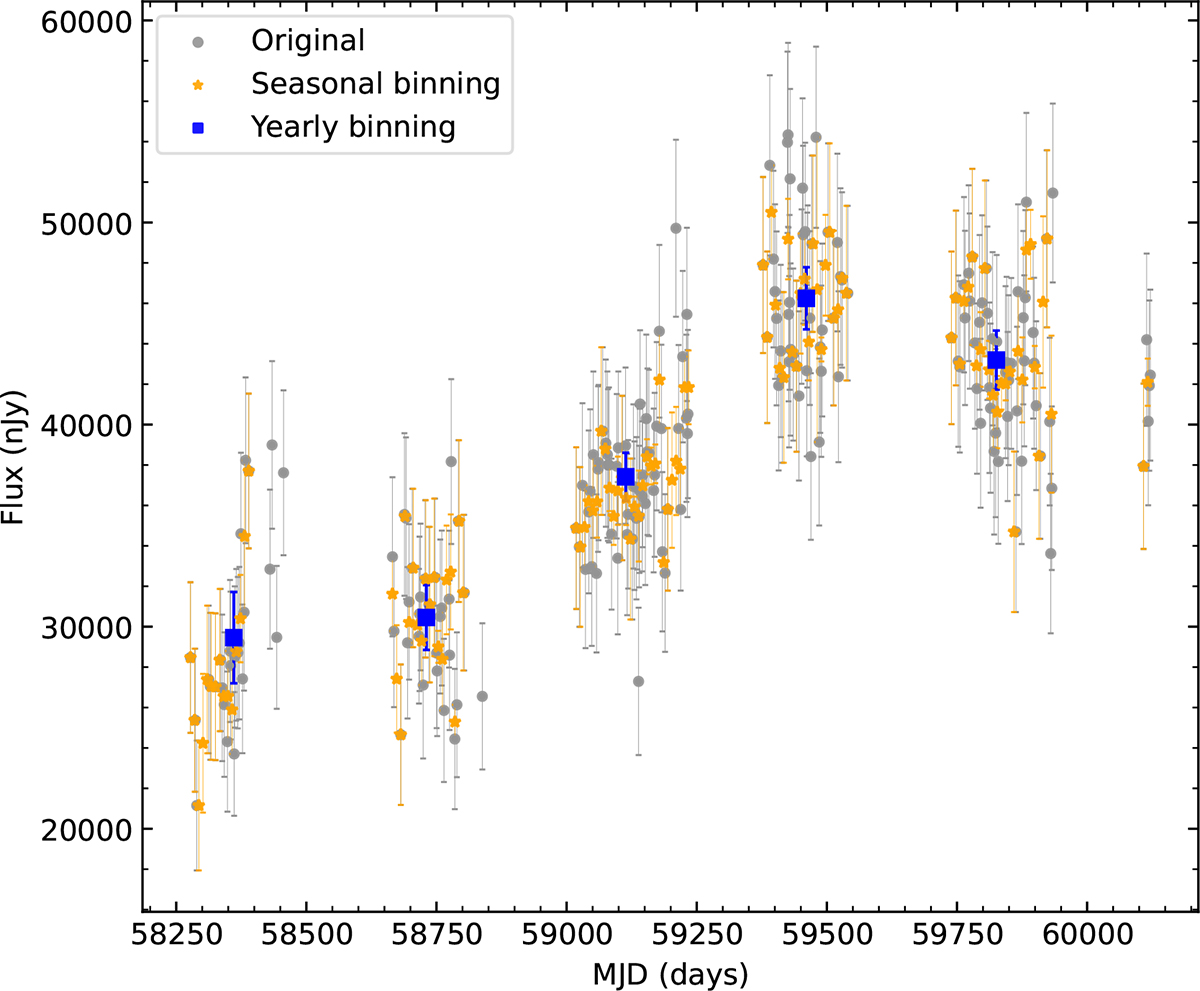
Download original image
Example light curve for a ZTF quasar in the r band. Grey points are the original flux measurements, while yellow stars indicate the binned-interpolated values turning each season into an evenly sampled time series to compute the high-frequency PSD in Sect. 3.1. The second half of the first season shows data points rejected from the analysis due to the quality cuts applied. Blue squares are yearly-binned points used for the low-frequency PSD in Sect. 3.2.
Current usage metrics show cumulative count of Article Views (full-text article views including HTML views, PDF and ePub downloads, according to the available data) and Abstracts Views on Vision4Press platform.
Data correspond to usage on the plateform after 2015. The current usage metrics is available 48-96 hours after online publication and is updated daily on week days.
Initial download of the metrics may take a while.