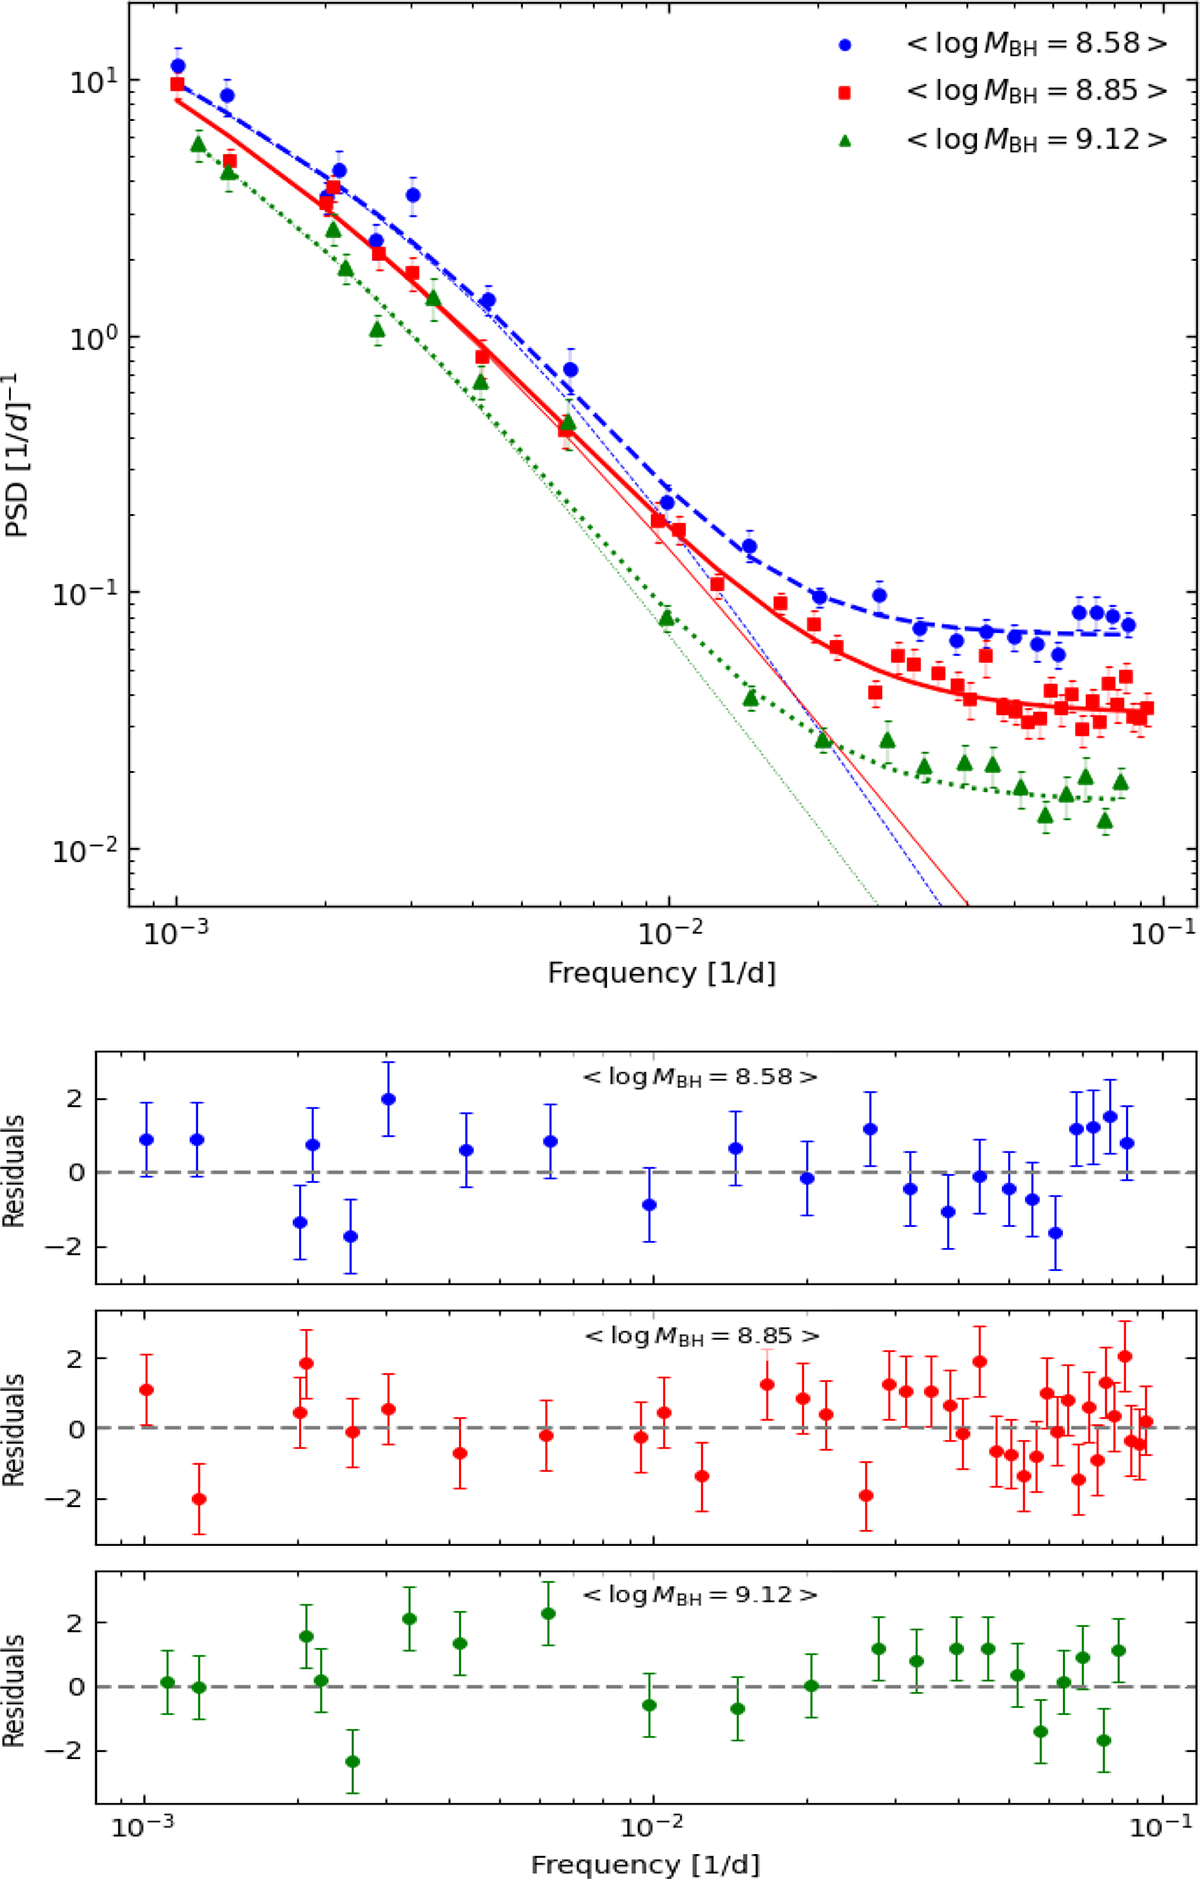
Fig. 6.
Download original image
Top panel: Ensemble power spectra for the quasars in the BHM1, BHM2, and BHM3 samples (mean values of the BH mass in each sample are reported in the legend). Dashed, solid, and dotted lines indicate the the best-fit BPL models to the power spectra. Thinner lines of the same colour and style are noise-subtracted. Bottom panels: Best-fit residuals.
Current usage metrics show cumulative count of Article Views (full-text article views including HTML views, PDF and ePub downloads, according to the available data) and Abstracts Views on Vision4Press platform.
Data correspond to usage on the plateform after 2015. The current usage metrics is available 48-96 hours after online publication and is updated daily on week days.
Initial download of the metrics may take a while.