Fig. 1
Download original image
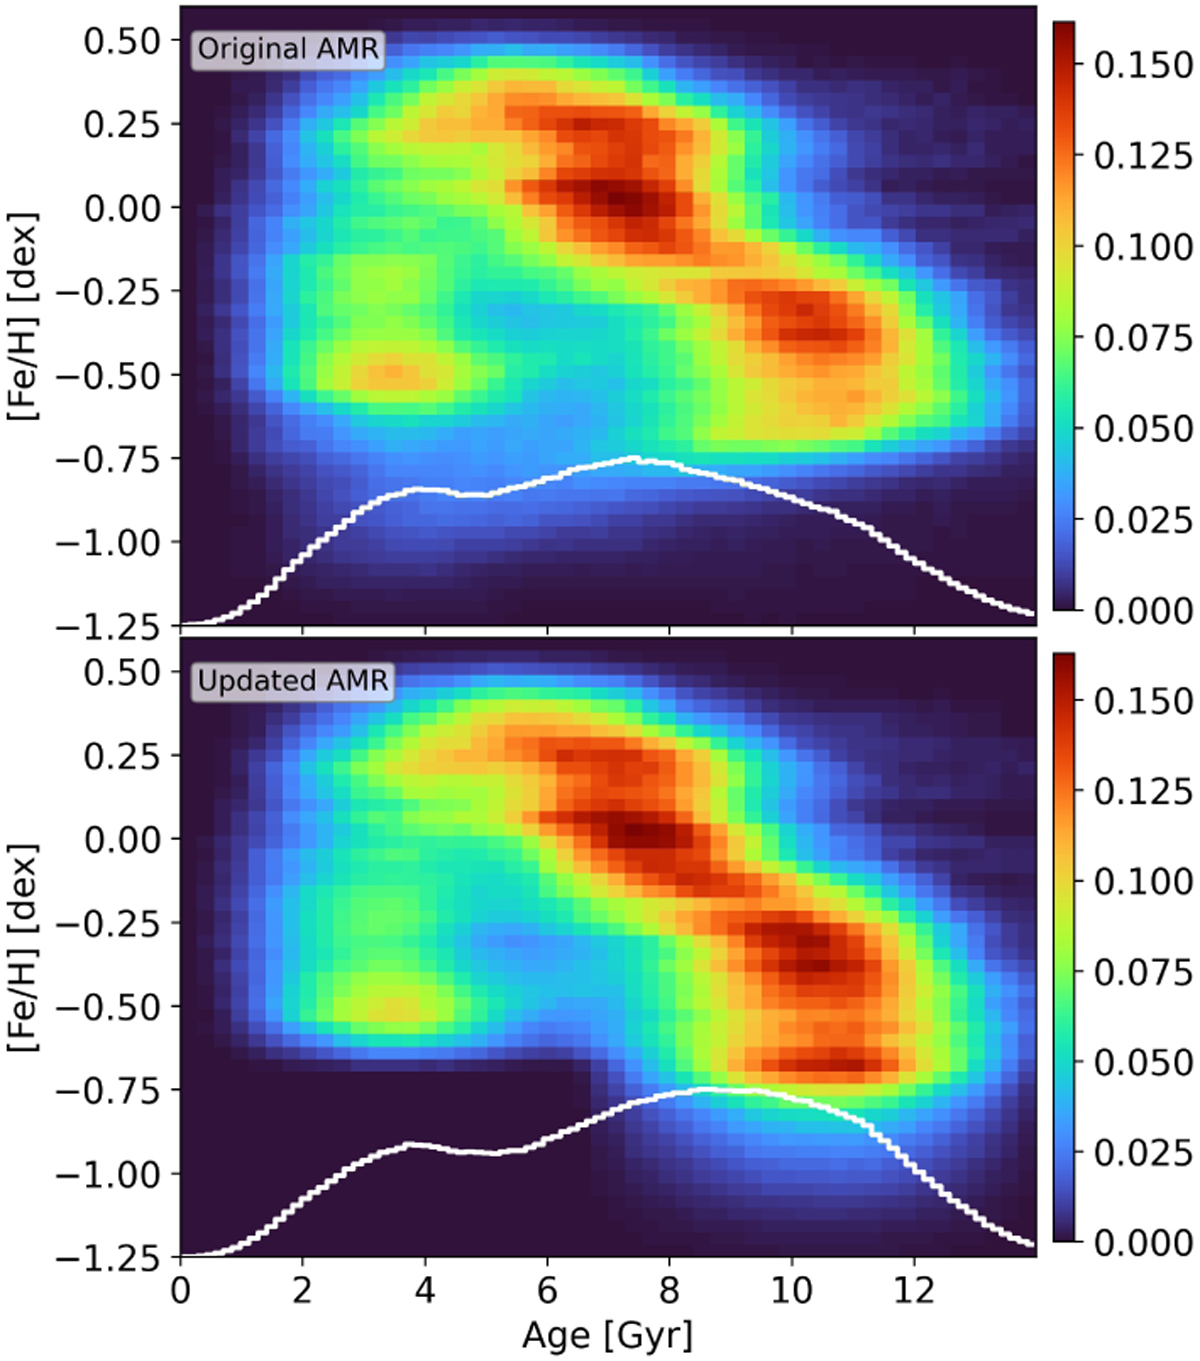
Age–metallicity relation of the initial stellar mass distribution derived from the orbit superposition modelling of APOGEE data. The bottom panel displays the age-metallicity relation after applying a correction to stellar ages of the young α–rich (YAR) and metal-poor populations. These revised ages were resampled from the high-α population, as described in Section 3.2. The corrected YAR and metal-poor stars together account for approximately 13% of the total stellar mass of the Galaxy. In both panels, the white histograms trace the age mass density distribution, while the colour bar illustrates the normalised, mass-weighted density of the age–metallicity relation. Fig. A.1 provides an additional comparison of the original and adjusted ages.
Current usage metrics show cumulative count of Article Views (full-text article views including HTML views, PDF and ePub downloads, according to the available data) and Abstracts Views on Vision4Press platform.
Data correspond to usage on the plateform after 2015. The current usage metrics is available 48-96 hours after online publication and is updated daily on week days.
Initial download of the metrics may take a while.