Fig. 3
Download original image
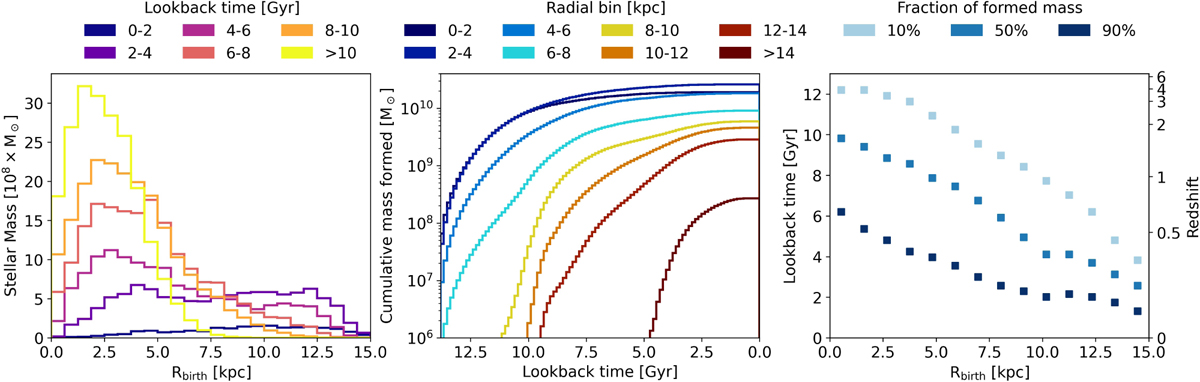
Inside-out mass growth of the MW stellar disc. Left: Rbirth distribution of stellar mass in different bins of the lookback time (stellar age). Middle: cumulative mass formed at a given Rbirth over time. The inner disc (blue lines) exhibits an initial growth with 80% of its mass created by 6–7 Gyr ago, while the outer disc (red lines) formed 80% of its mass <4 Gyr ago. Right: lookback time distribution of stellar mass formation within a 1-kpc-wide radial bin, expressed as a percentage of the total mass formed at the corresponding radius. The symbols show at what lookback time 10 (light blue), 50 (blue), and 90% (dark blue) of mass formed at a given distance from the centre.
Current usage metrics show cumulative count of Article Views (full-text article views including HTML views, PDF and ePub downloads, according to the available data) and Abstracts Views on Vision4Press platform.
Data correspond to usage on the plateform after 2015. The current usage metrics is available 48-96 hours after online publication and is updated daily on week days.
Initial download of the metrics may take a while.