Fig. 6
Download original image
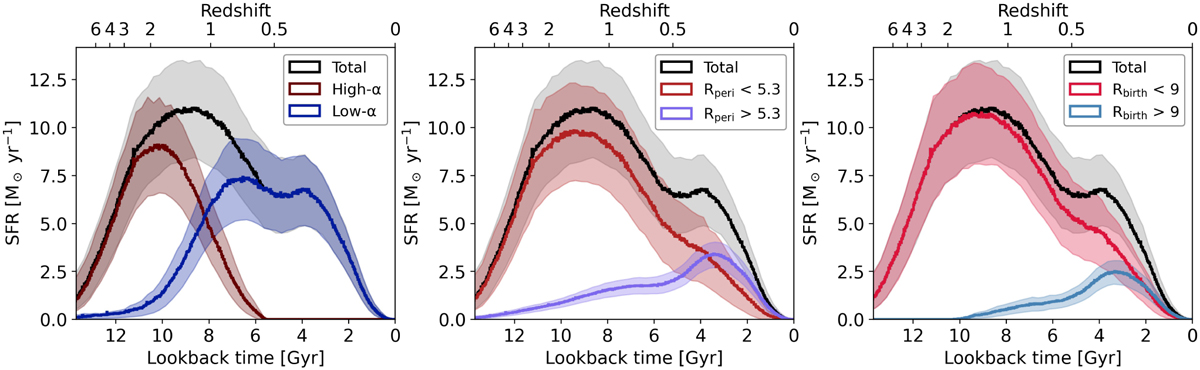
SFH of the MW disc and its sub-populations. The black curve represents the stellar mass formed per unit time as a function of lookback time, normalised by the time bin width. Left: breakdown of the SFR into high- and low-α populations, in red and blue, respectively. Middle: SFRs of the present-day kinematically defined inner (Rperi < 5.3 kpc, red) and outer (Rperi > 5.3 kpc, violet) discs. Right: SFRs of populations formed inside and outside of 9 kpc, in red and blue, respectively. In each panel, the shaded areas show the 16–84% confidence of a given SFH.
Current usage metrics show cumulative count of Article Views (full-text article views including HTML views, PDF and ePub downloads, according to the available data) and Abstracts Views on Vision4Press platform.
Data correspond to usage on the plateform after 2015. The current usage metrics is available 48-96 hours after online publication and is updated daily on week days.
Initial download of the metrics may take a while.