Open Access
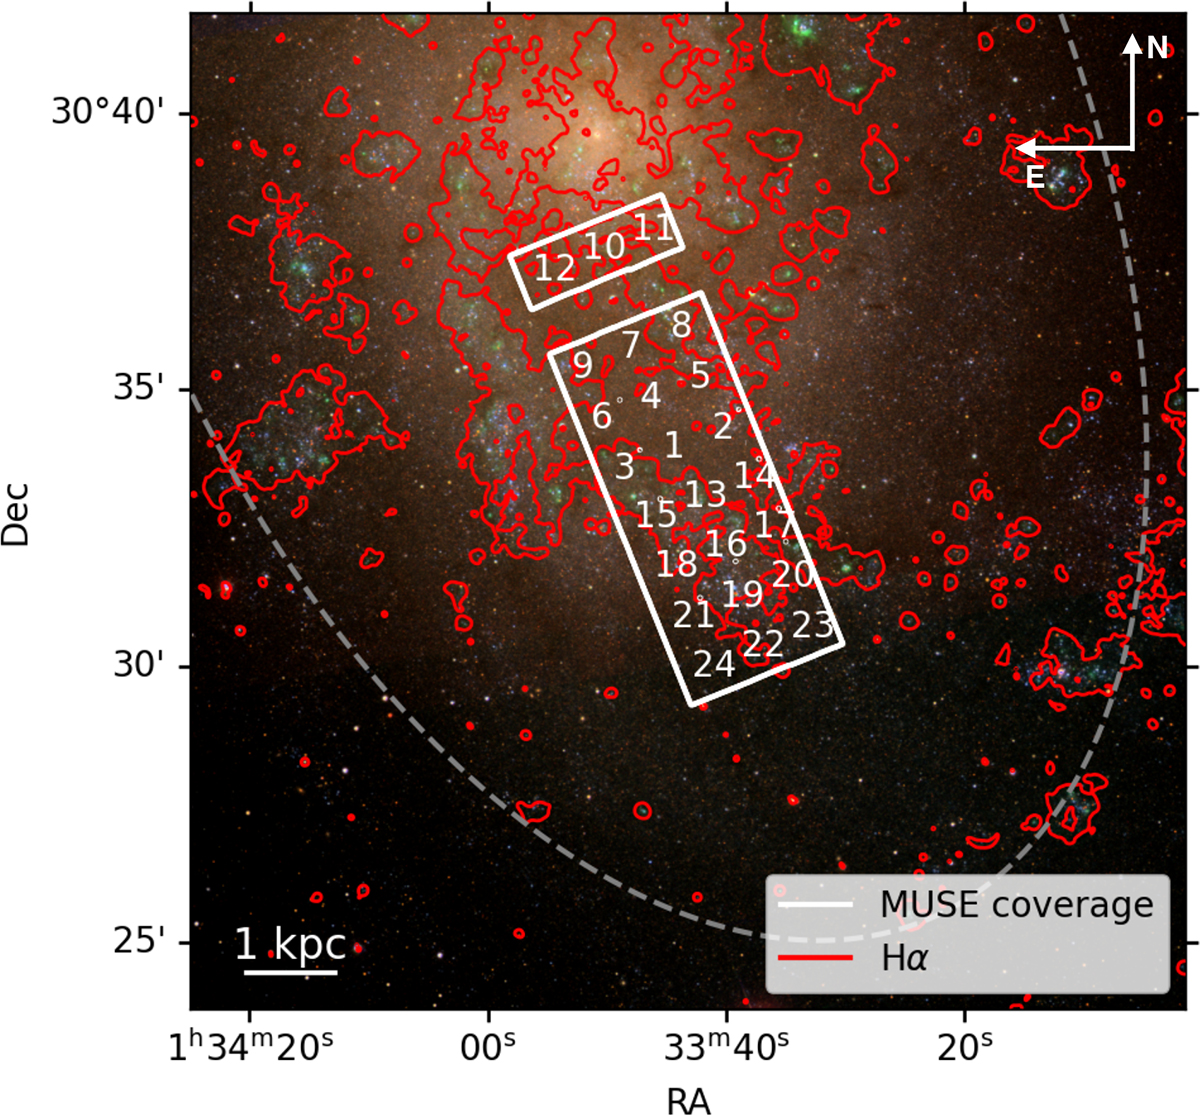
Fig. 1.
Download original image
Image of M33 using g − r − i SDSS bands and showing the area of the galaxy targeted by MUSE (white contours). The positions of the centres of the individual MUSE pointings (1–24) are also shown. The red-coloured contours correspond to areas of high Hα emission from the ground-based image of Massey et al. (2006).
Current usage metrics show cumulative count of Article Views (full-text article views including HTML views, PDF and ePub downloads, according to the available data) and Abstracts Views on Vision4Press platform.
Data correspond to usage on the plateform after 2015. The current usage metrics is available 48-96 hours after online publication and is updated daily on week days.
Initial download of the metrics may take a while.