Fig. B.3.
Download original image
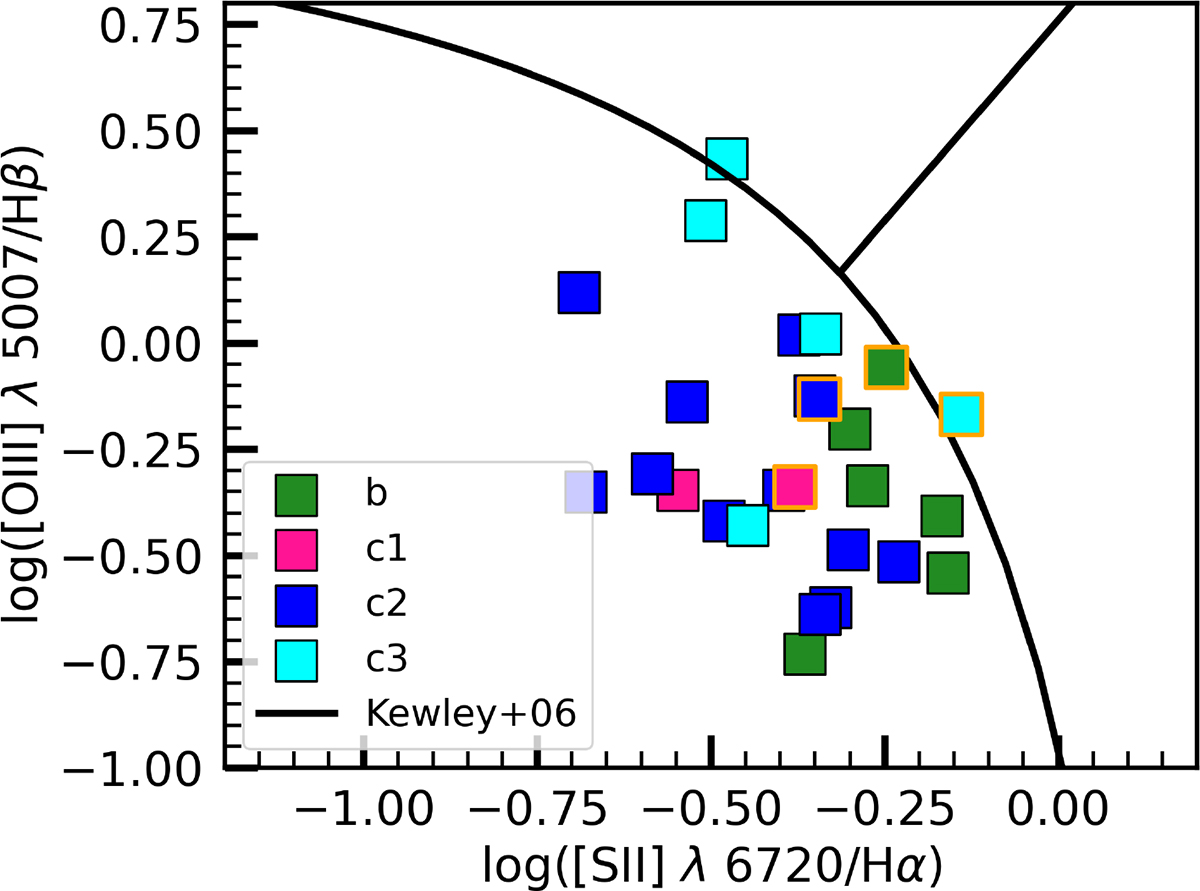
Type b and c YSCCs from Corbelli et al. (2017) on the O III/Hβ versus N II/Hα line-ratio diagram. The YSCCs types are colour-coded as labelled in the legend. The YSCCs with orange edges are those in the vicinity or co-spatial with SNRs. Continuous curve shows the demarcation criteria between the star-forming and active galactic nuclei by Kewley et al. (2006).
Current usage metrics show cumulative count of Article Views (full-text article views including HTML views, PDF and ePub downloads, according to the available data) and Abstracts Views on Vision4Press platform.
Data correspond to usage on the plateform after 2015. The current usage metrics is available 48-96 hours after online publication and is updated daily on week days.
Initial download of the metrics may take a while.