Fig. D.1.
Download original image
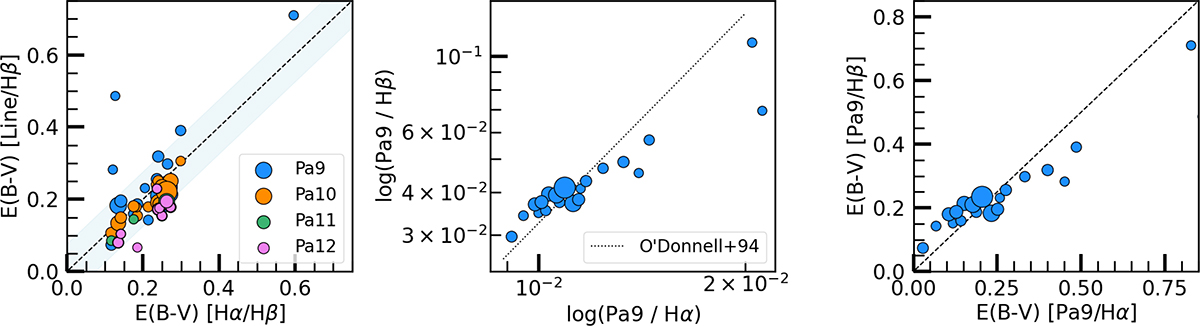
Comparison of dust reddening inferred using Balmer and Paschen lines. Left panel: E(B-V) computed assuming case B hydrogen recombination and using lines of the Paschen series (Pa9, Pa10, Pa11 and Pa12 as colour coded in the legend) versus E(B-V) from the Balmer decrement. Central panel: Pa9λ9229/Hβ/ versus Pa9λ9229/Hα line ratios. Dotted gray line is the O’Donnell (1994) attenuation curve. Right panel: Comparison of E(B-V) inferred from the dust attenuation corrected Pa9λ9229/Hβ and Pa9λ9229/Hα ratios. Dashed black lines indicate the 1:1 relations. Symbol sizes increases with increasing S/N, starting from S/N = 5 up to 16.
Current usage metrics show cumulative count of Article Views (full-text article views including HTML views, PDF and ePub downloads, according to the available data) and Abstracts Views on Vision4Press platform.
Data correspond to usage on the plateform after 2015. The current usage metrics is available 48-96 hours after online publication and is updated daily on week days.
Initial download of the metrics may take a while.