Open Access
Fig. E.1.
Download original image
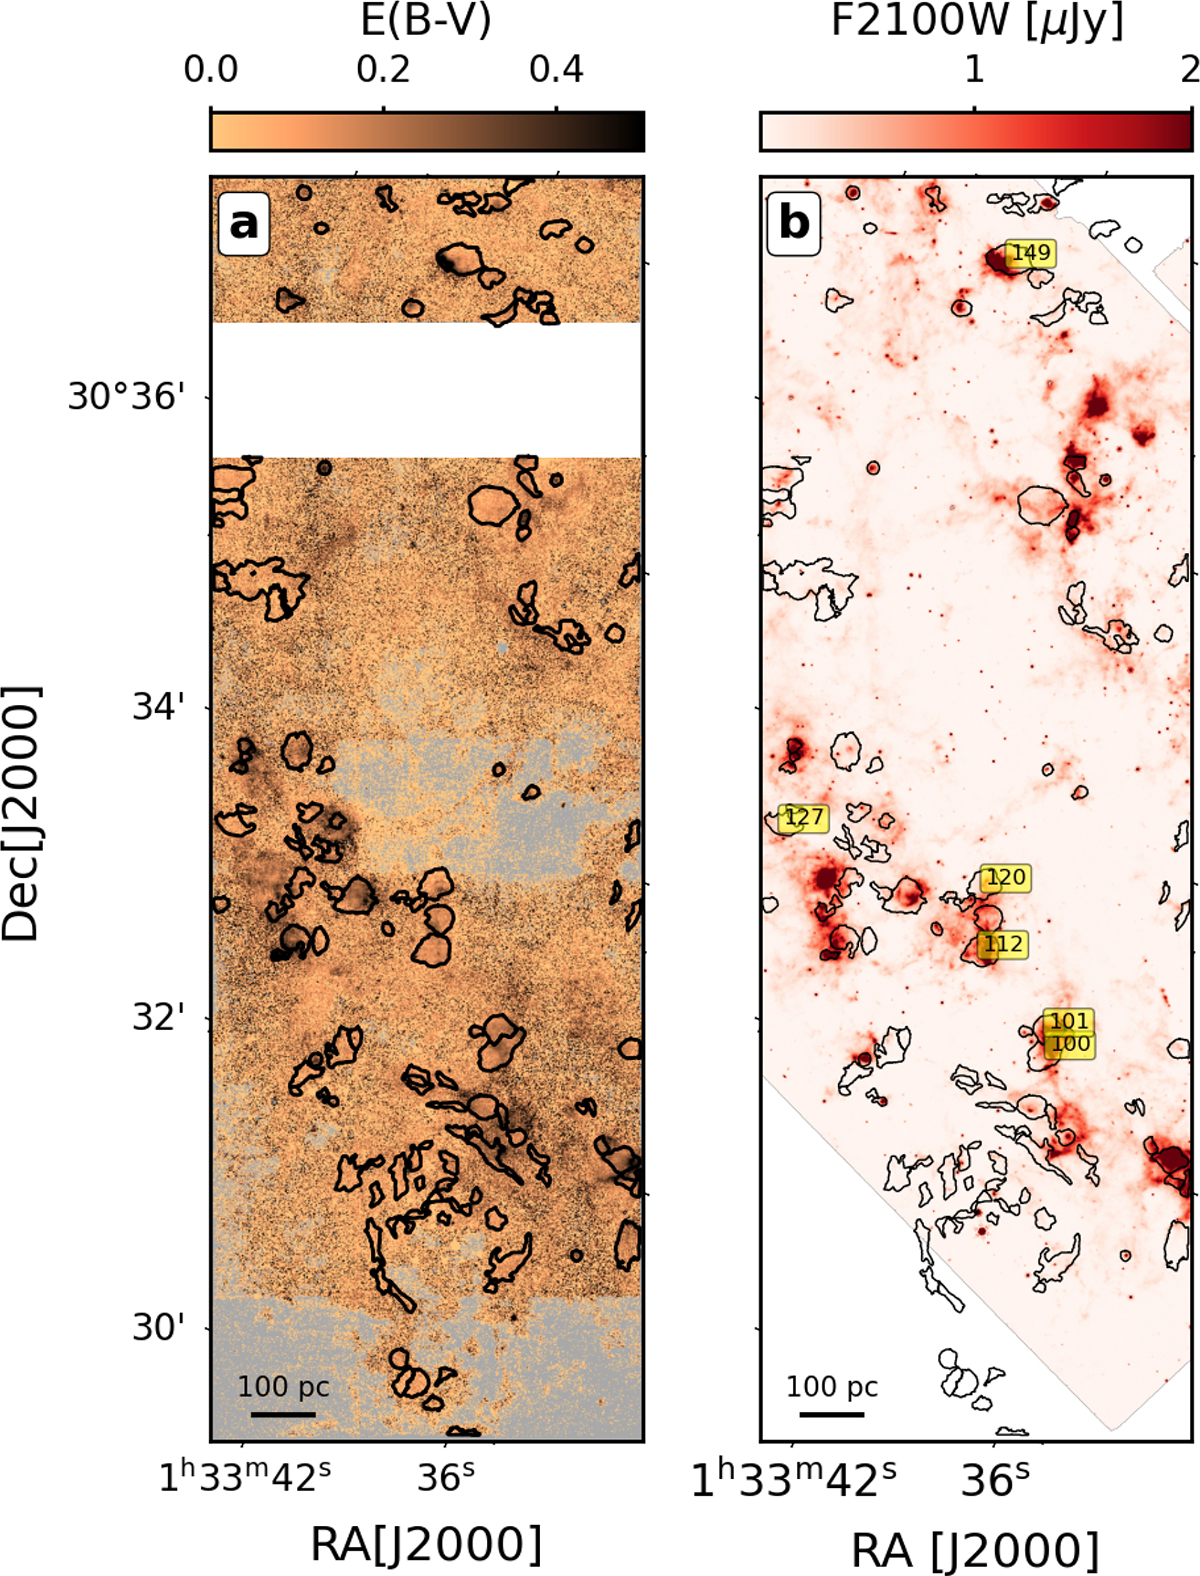
Two dimensional dust maps of M33: E(B-V) and MIRI F2100W maps in panel a and b, respectively. As in Fig. 5 black contours represent the nebular masks classified as H II regions. In panel b, numbered labels indicate specific nebular masks discussed in the main text.
Current usage metrics show cumulative count of Article Views (full-text article views including HTML views, PDF and ePub downloads, according to the available data) and Abstracts Views on Vision4Press platform.
Data correspond to usage on the plateform after 2015. The current usage metrics is available 48-96 hours after online publication and is updated daily on week days.
Initial download of the metrics may take a while.