Fig. 2.
Download original image
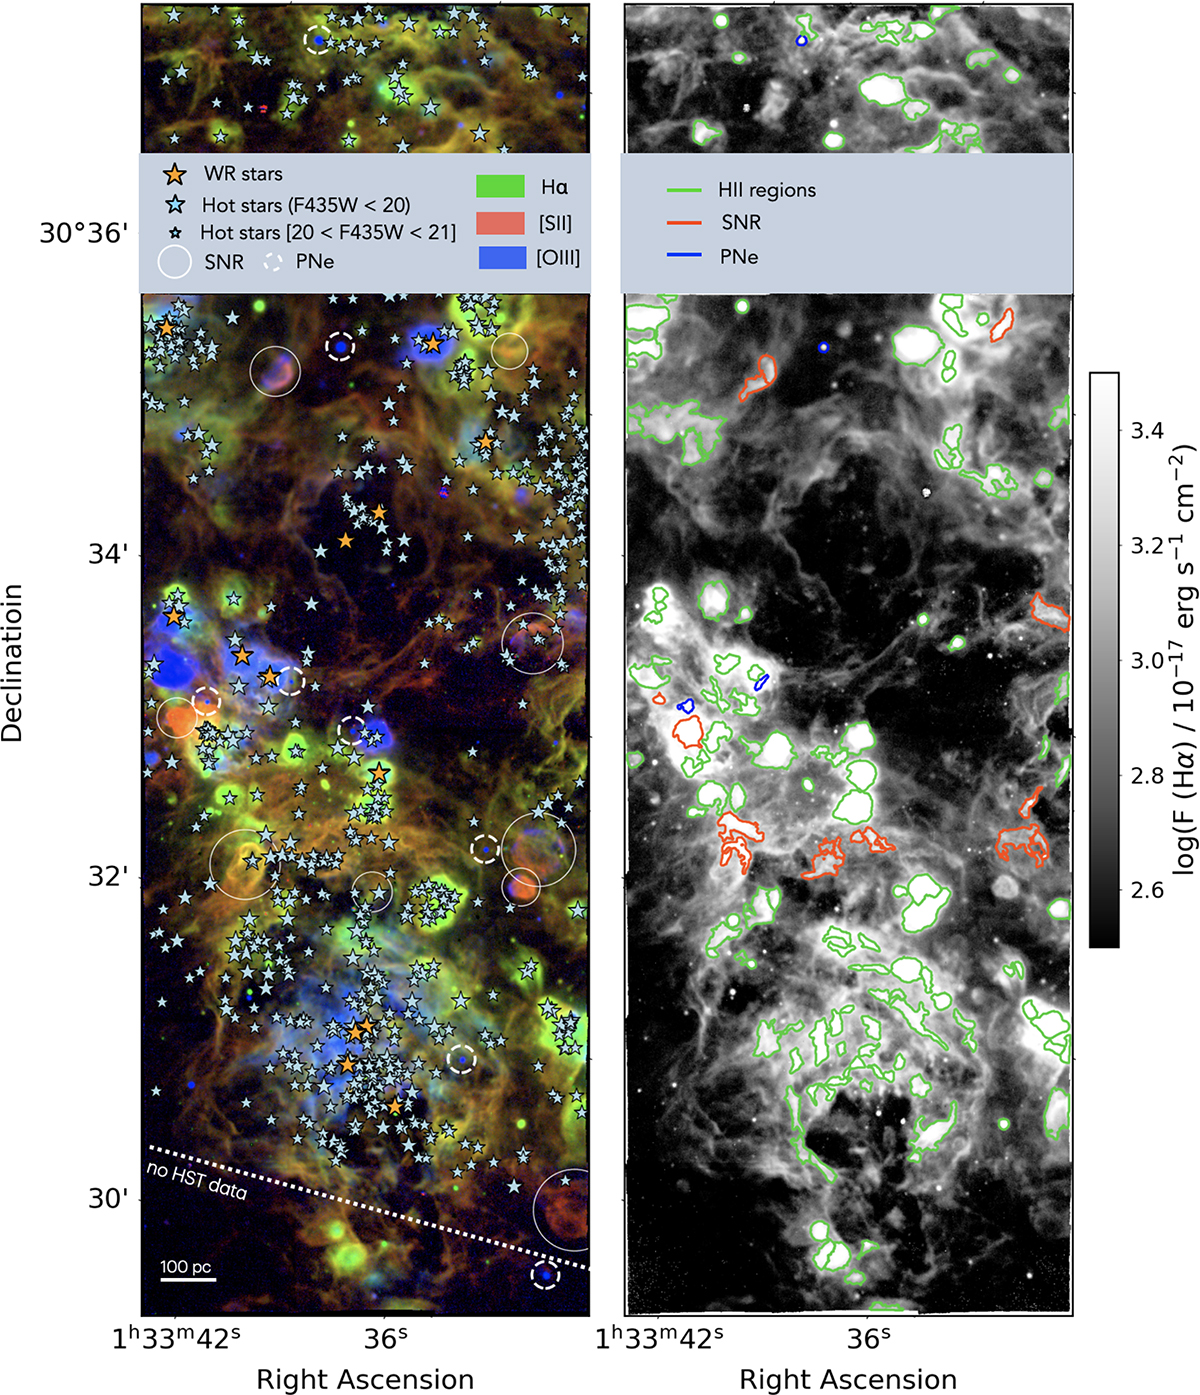
Emission maps of M33 MUSE data. Left: three-colour image from MUSE mapping the ionised gas emission: [O III]λ5007 in blue, Hα in green and [S II]λ6716, 6731 in red. Light-blue stars are the 552 stars selected from the PHATTER survey (Williams et al. 2021) as described in Appendix B.1. Smaller and larger star symbols denote two ranges of F475W magnitude, between 20 and 21 and below 20, respectively. Orange stars are WR stars from Neugent & Massey (2011, 2019) (Appendix B.2). White solid and dashed circles denote SNRs from Lee & Lee (2014) and PNe from Ciardullo et al. (2004), respectively (Appendices B.5 and B.6). Right: Hα map from MUSE with the final configuration of the nebular masks, colour-coded on the basis of their classification as labelled in the legend.
Current usage metrics show cumulative count of Article Views (full-text article views including HTML views, PDF and ePub downloads, according to the available data) and Abstracts Views on Vision4Press platform.
Data correspond to usage on the plateform after 2015. The current usage metrics is available 48-96 hours after online publication and is updated daily on week days.
Initial download of the metrics may take a while.